An operations platform starts with a simple question: how do we know whether an agent is online?
The smallest version is almost boring. The frontend sends a heartbeat every few seconds. The backend stores last_seen_at. If the timestamp is too old, the agent becomes offline.
That version can light up a green dot. It is nowhere near enough for dispatching, workforce management, routing, monitoring, and time tracking. In the system I worked on, the HCM and Heartbeat path served 47,149 agents, 7,000 skill groups, about 4,000 QPS, and 141 upstream services. At that scale, “online” becomes a state platform.
Here is the target shape first.
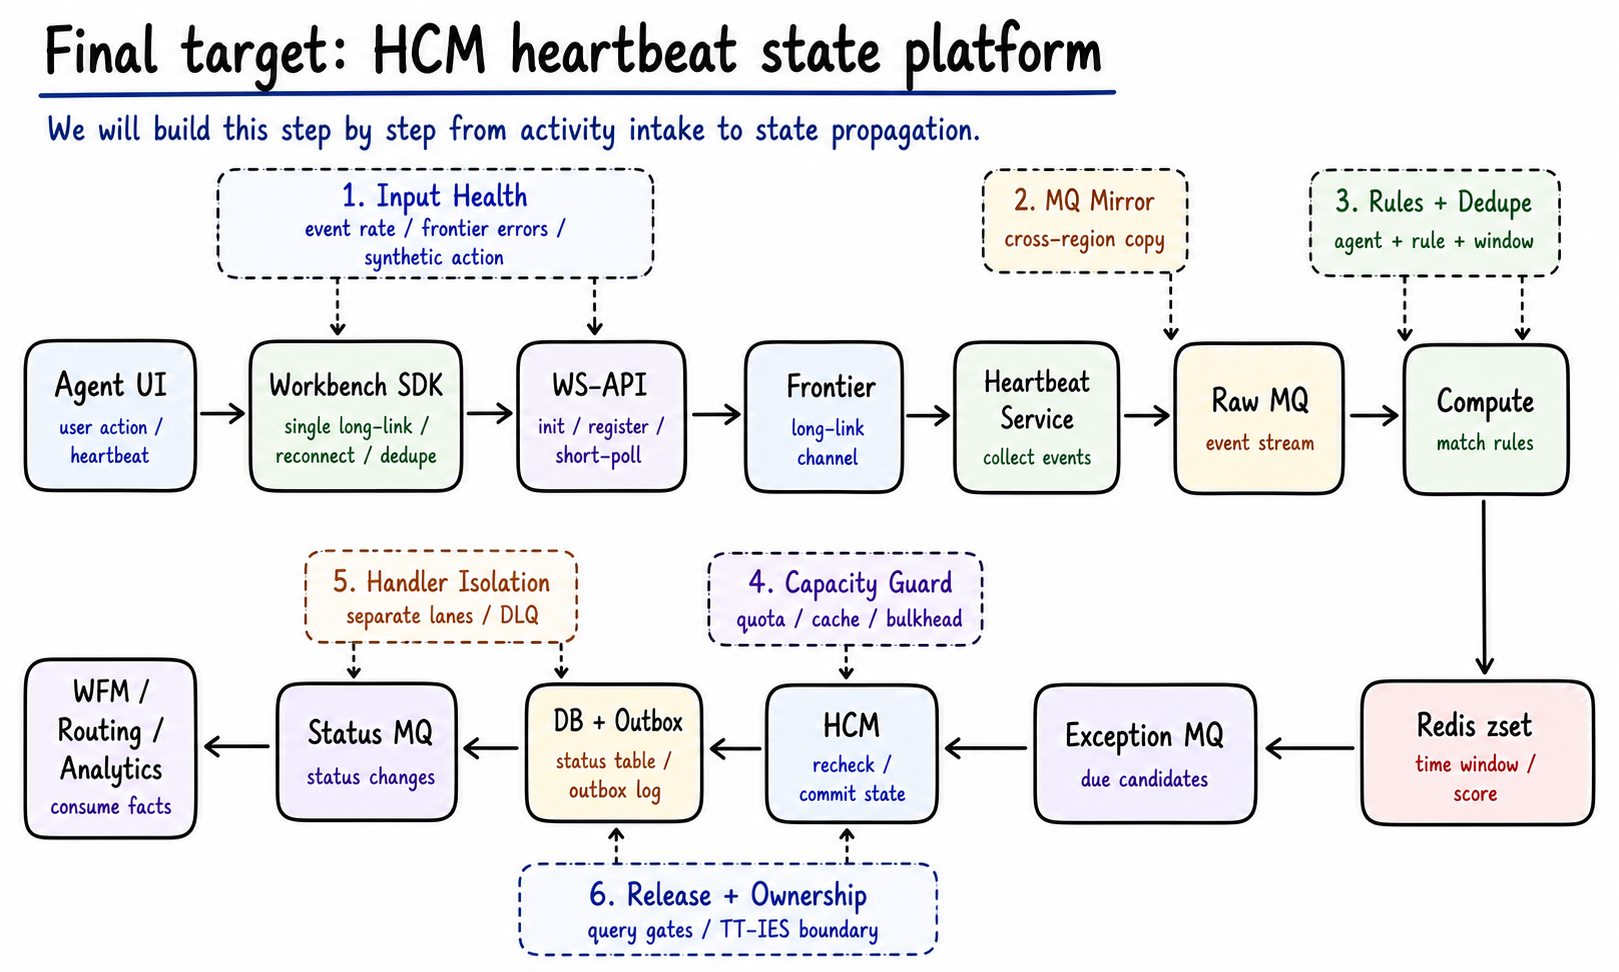
Figure 0: The final target is a state platform. User activity enters through the Workbench SDK, WS-API, and Frontier long-link path, then flows through Heartbeat, MQ, Compute, HCM, and downstream state propagation. Generated by gpt-image-2.
The rest of this article builds the system from last_seen_at to that final design, one engineering problem at a time.
Can we tell whether an agent is active?
Version 0 writes state directly.
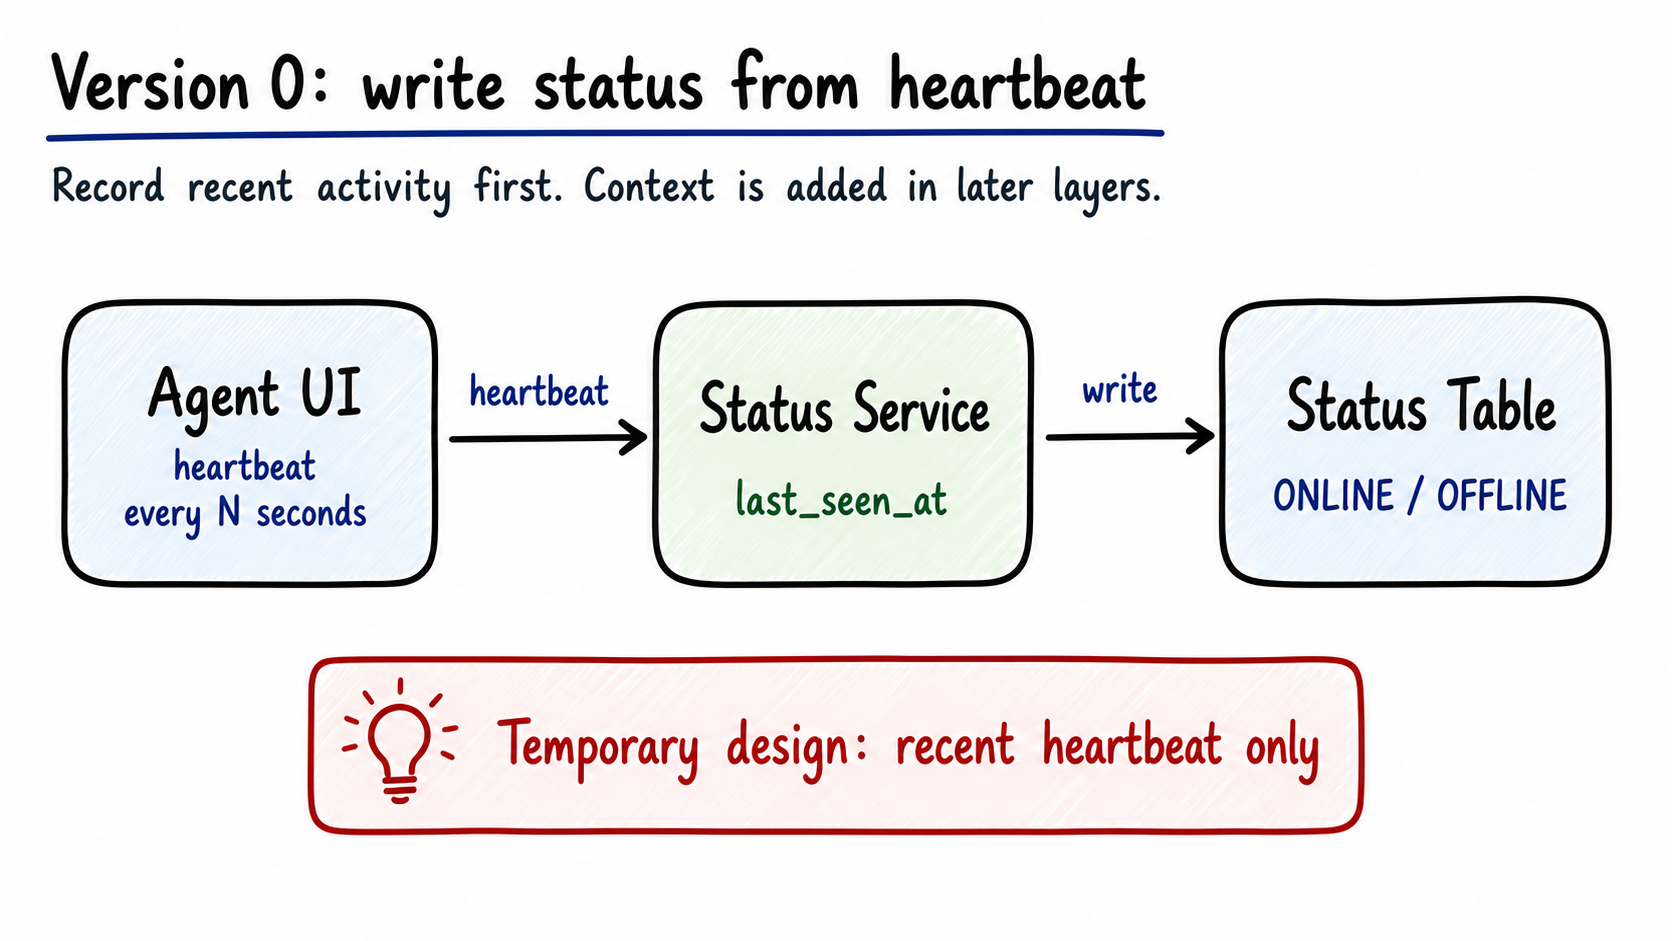
Figure 1: The naive heartbeat design records the latest heartbeat timestamp. It has no task count, skill group context, business rules, or region ownership. Generated by gpt-image-2.
The data model is tiny:
1 | agent_id |
The frontend reports heartbeat events. The backend updates last_seen_at. A scheduled job scans expired records and marks agents as OFFLINE.
This model works for a lightweight presence indicator. Before we even talk about task count or skill groups, the intake path already has problems:
- A workbench page has multiple modules. They should not each open their own channel.
- User activity is bursty. A typing burst should not become a synchronous write storm.
- Browser connections drop. A reconnect should not make the system lose recent activity.
- Long-link push and short-poll compensation can deliver the same logical message twice.
- Heartbeat service restarts should not erase the input stream.
- State calculation should be deployable without changing the browser SDK.
last_seen_at gives us a timestamp. The next problem is to turn browser activity into a reliable event stream.
How do UI events enter Heartbeat reliably?
The next layer moves activity intake out of direct writes and into an event stream.
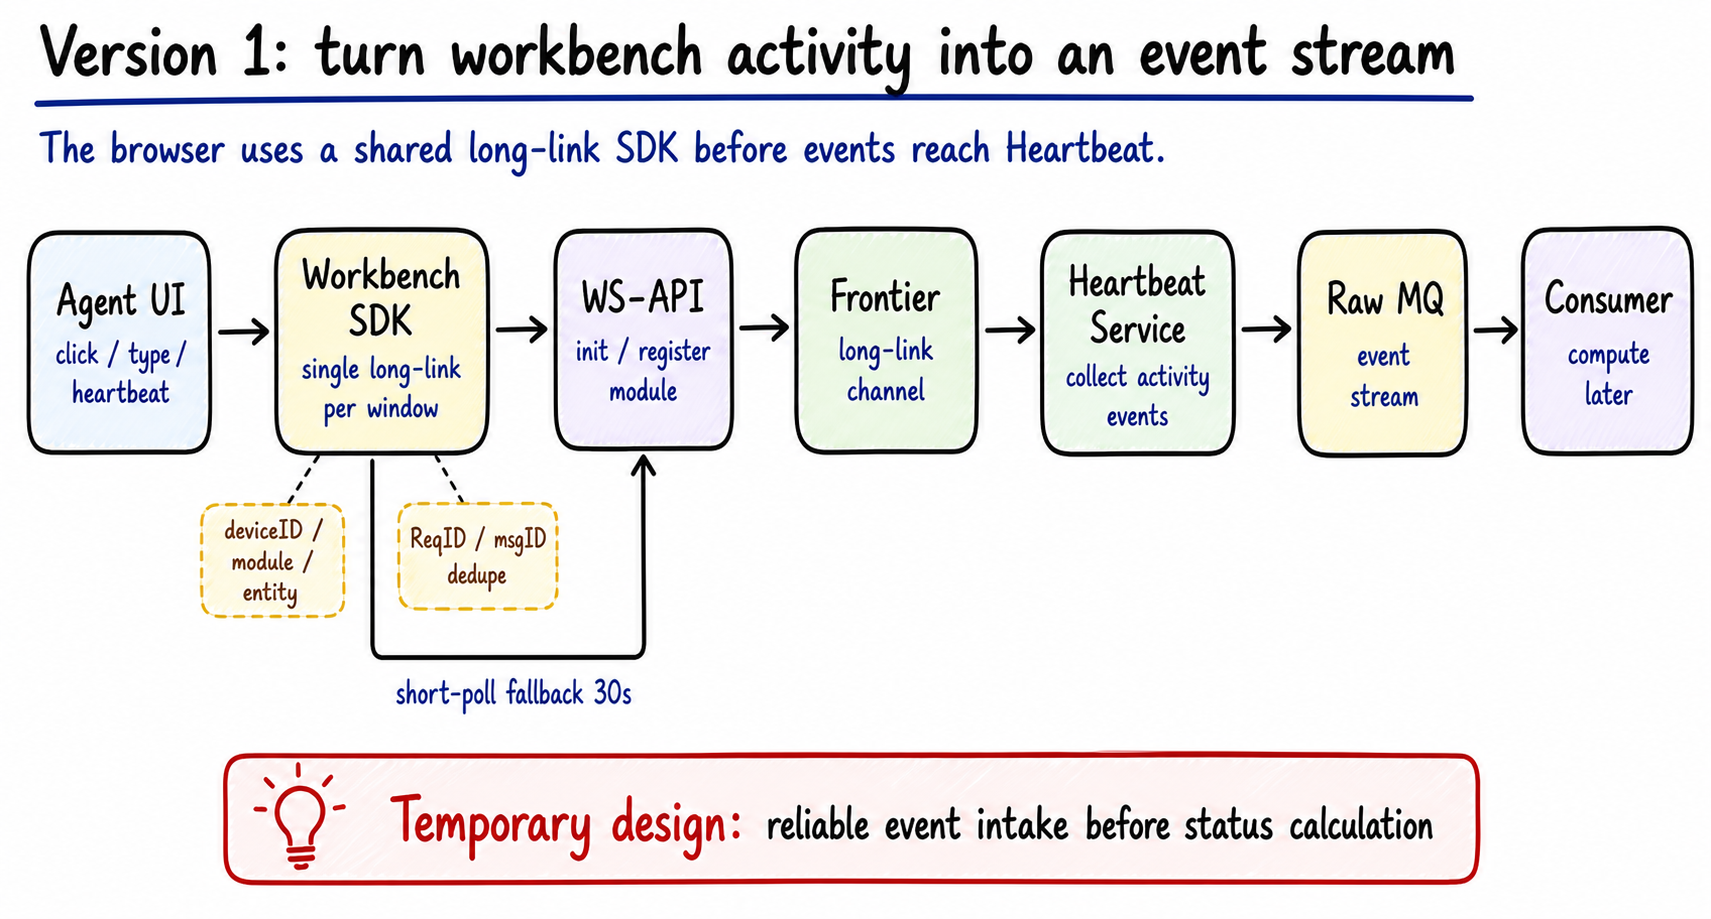
Figure 2: Workbench activity enters through SDK, WS-API, and Frontier before Heartbeat writes the raw event stream to MQ. State calculation comes later. Generated by gpt-image-2.
The frontend does more than send a periodic heartbeat. It reports clicks, key events, mouse activity, URL changes, ticket open, ticket reply, ticket completion, handoff, escalation, and other workbench actions.
These events mean different things, but they share one property: they prove an agent did something at a specific time.
Between the agent UI and Heartbeat, the workbench uses a long-link path:
1 | Agent UI |
The Workbench SDK keeps one long-link connection per window. Business modules register by module + entity, and deviceID identifies the channel. That granularity matters. If entity is too fine, a user switching entities can hit a short unregistered window and lose a push.
WS-API handles long-link initialization, module registration, deregistration, and short-link compensation. Frontier owns the long-link channel. When Frontier has problems, the client can use short polling to fetch messages that were not acked. The default interval is 30 seconds and can be lowered by configuration during an incident.
We also dedupe early. Business messages carry ReqID, and the SDK keeps a recent ReqID cache. The RPC push service generates msgID, so long-link delivery and short-poll compensation can dedupe the same logical message. If a business flow needs ordering, it carries an Index; ordering semantics stay with the business.
Each node earns its place:
| Node / change | Problem it solves | Software engineering idea |
|---|---|---|
| Workbench SDK | Multiple modules in one page need one shared client-side channel | Connection pooling and client-side ownership |
module + entity registration |
Events must be routed to the right business module without opening new links | Namespacing and subscription boundaries |
deviceID |
A backend push target needs a stable browser-window identity | Session identity |
| WS-API | Init, register, deregister, and compensation need one control surface | Control plane separate from data delivery |
| Frontier | Long-link delivery should be handled by a dedicated channel service | Separation of concerns |
| Short-poll compensation | Long-link outages should not drop recent messages | Graceful degradation |
ReqID / msgID dedupe |
Push and compensation can deliver the same logical event twice | Idempotency |
| Raw MQ | Bursty activity and service restarts should not hit Compute directly | Backpressure and durable buffering |
| Heartbeat intake service | Browser protocol details should not leak into Compute | Adapter boundary |
The queue contains input, not truth.
If a consumer turns every keyup into ONLINE, and every missing event into ABNORMAL, the system will still misclassify people. Events lack task count, skill group membership, work status, rule scope, and notification history.
That leads to the next set of questions, which are about business context: can this agent receive a ticket, which skill groups does the rule cover, has the abnormal status already been handled, and which region can emit a state change? Compute and HCM own those decisions.
That leads to the compute layer.
How do events become state candidates?
Compute turns raw activity into candidate state changes.
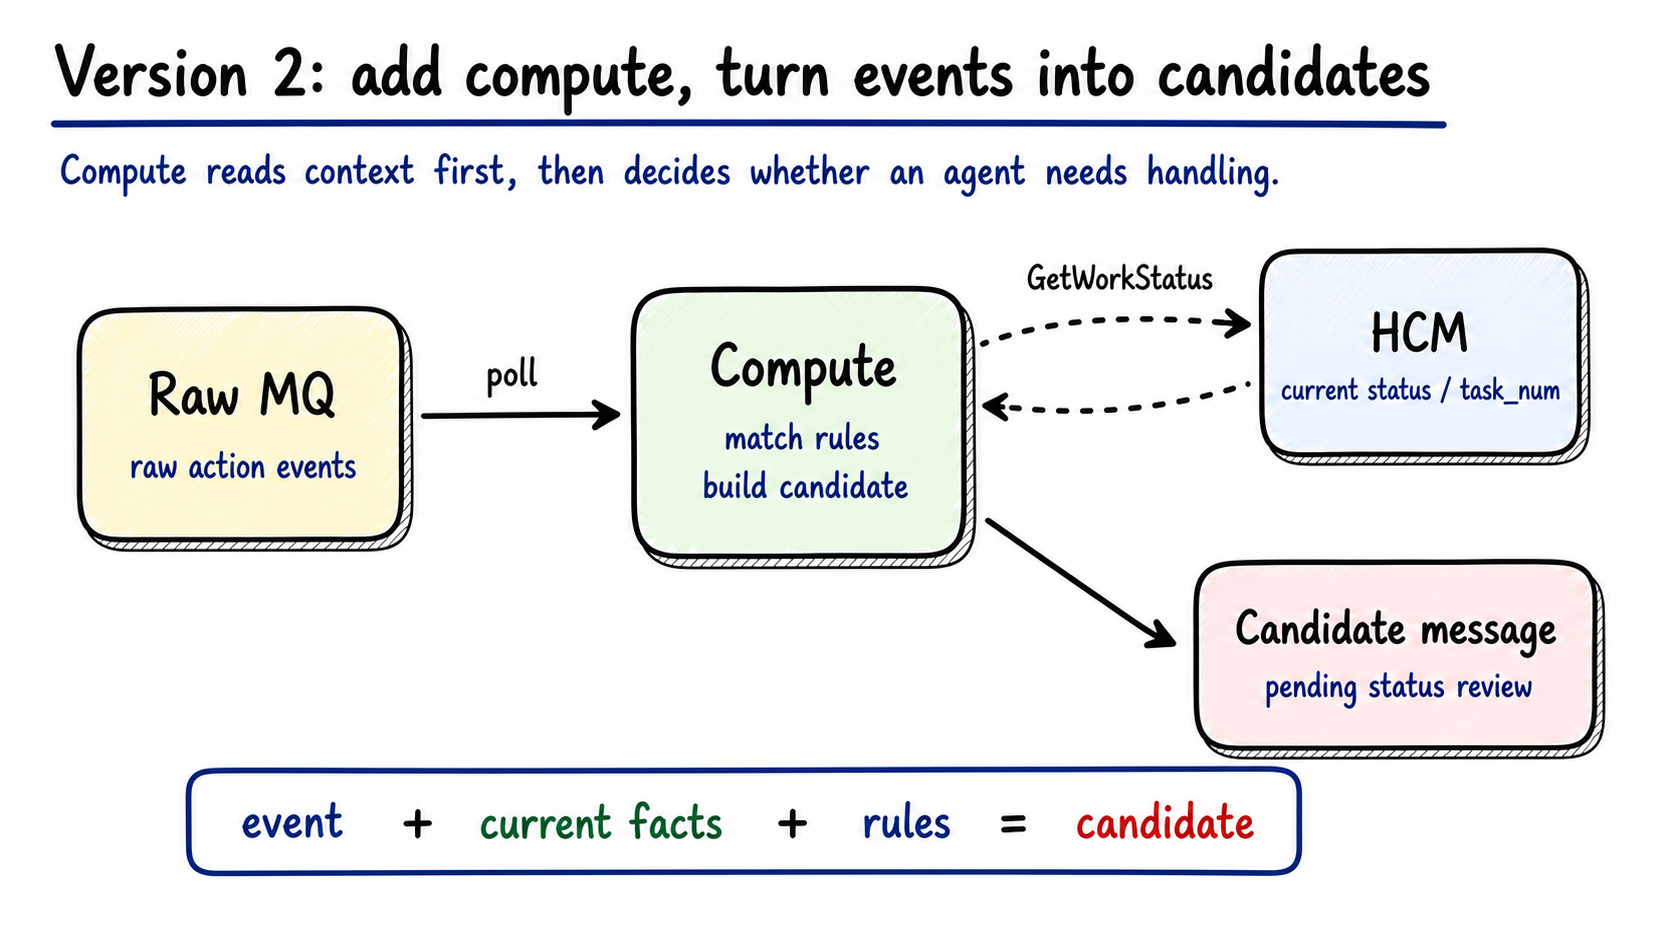
Figure 3: Compute consumes raw events, reads current facts from HCM, and produces candidate status changes. Generated by gpt-image-2.
Compute has one job: convert “an event happened” into “this agent may need a state change.”
Event types fall into a few groups:
| Type | Meaning |
|---|---|
1 |
Online heartbeat |
2 |
Work status change |
3-12 |
Ticket opened, replied, completed, transferred, escalated |
100-105 |
Click, key event, mouse, status switch, outbound call, URL change |
3001 |
No action for 15 minutes result |
3002 |
Abnormal for 15 minutes result |
3003 |
Not on app |
4000 |
Rule Config V2 result |
Compute does not write the final status. It first asks HCM for current facts:
1 | GetWorkStatus(agent_id, tenant_id, channel) |
HCM returns current work status, task count, skill group membership, and related facts. Compute combines those facts with the rule configuration:
1 | event + current facts + rule = candidate |
A candidate is still only a candidate. An agent may have no action after 10:00, so Compute may produce an abnormal candidate at 10:10. At 10:10:01, the agent may receive a new ticket. HCM must re-read the facts before committing the state.
Keep that boundary hard: Compute calculates candidates. HCM commits facts.
Version 2 adds these pieces for specific reasons:
| Node / change | Problem it solves | Software engineering idea |
|---|---|---|
| Compute | Raw events need business interpretation before they can affect state | Domain service boundary |
GetWorkStatus read |
A candidate needs current task, status, and skill group facts | Read-before-decide |
| Candidate state change | Calculation should not write final truth directly | Command staging |
| Rule configuration | Status logic changes faster than service code | Policy/data separation |
| HCM recheck requirement | Facts can change after Compute produced a candidate | Optimistic validation |
How do we calculate “no action for N minutes”?
Many heartbeat rules are time-window rules:
| Scenario | System action |
|---|---|
ONLINE and no task for 30 seconds |
Move to IDLE |
ONLINE / IDLE / BUSY and no action, or not on app, for 8 minutes |
Send a reminder |
ONLINE / IDLE / BUSY and no action, or not on app, for 10 minutes |
Move to ABNORMAL |
ABNORMAL and still no action, or not on app, for another 10 minutes |
Move to OFFLINE |
The obvious implementation is one timer per agent.
That becomes painful quickly. Timers disappear on process restart. Autoscaling spreads timers across instances. Region cutover now has to move timer ownership. For tens of thousands of agents, in-process timers couple business state to instance lifetime.
We used Redis zset to represent time windows.
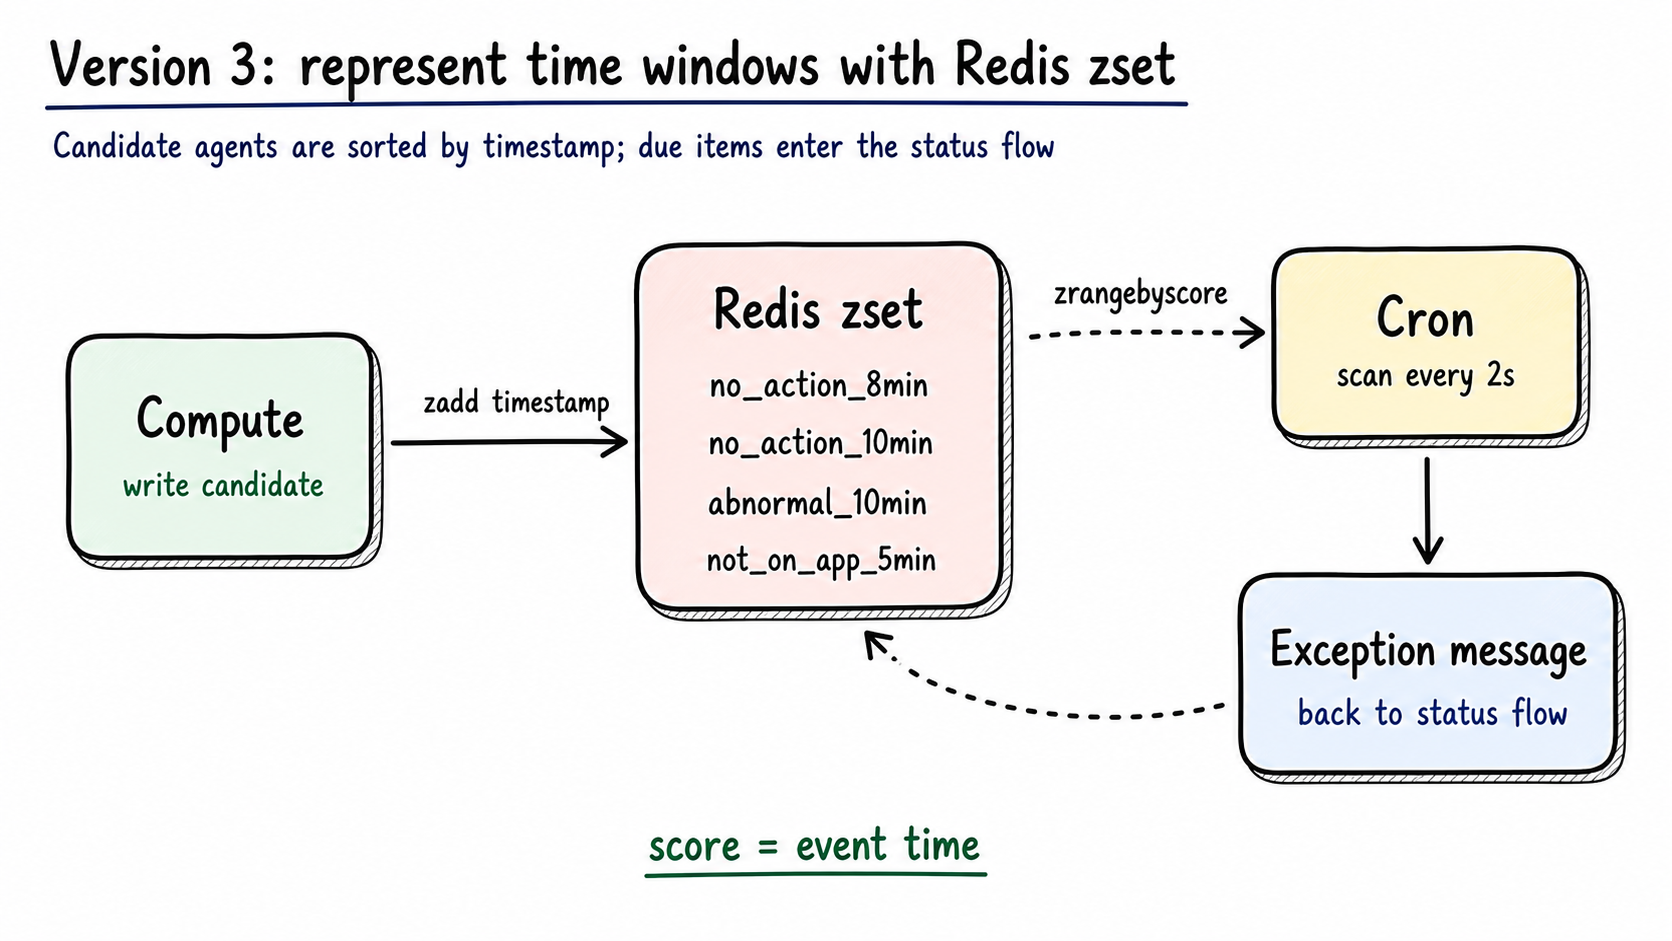
Figure 4: Candidate agents are written into Redis zsets by event timestamp. Cron scans due records and sends exception messages back into the state update path. Generated by gpt-image-2.
Redis keeps several queues:
1 | agent_no_action_for_8_min |
The zset score is the timestamp. A due scan uses zrangebyscore for everything older than now - threshold.
This data structure fits the problem:
| Need | zset behavior |
|---|---|
| Time-window checks | Score is timestamp |
| Compute restart safety | Candidates stay in Redis |
| Multiple rules | Separate zsets per rule family |
| Duplicate reminder control | Add agent/message/rule locks |
| Canary and rollback | Queue, rule, and IDC switches stay configurable |
Cron scans every 2 seconds. Before emitting messages, it checks whether the current IDC can send and grabs a short TTL global lock to avoid duplicate emission from multiple instances.
One detail matters more than it looks: the business window and the dedupe lock window should be different.
For a 10-minute no-action reminder, the business threshold is 600 seconds. The agent-level dedupe lock can be 840 seconds. That reduces reminder spam while still leaving room for later transitions such as ABNORMAL -> OFFLINE.
Version 3 adds these pieces:
| Node / change | Problem it solves | Software engineering idea |
|---|---|---|
| Redis zset | Tens of thousands of timers should not live inside process memory | Externalized state |
| Timestamp score | Due candidates need efficient time-window scans | Index by time |
| Separate rule queues | Different windows and rules should not share hidden state | Work partitioning |
| Cron scanner | Due work needs a repeatable executor outside request flow | Scheduled worker |
| Global TTL lock | Multiple instances may scan the same queue | Lease-based coordination |
| Dedupe lock window | Repeated reminders should be bounded independently from rule threshold | Idempotency window |
Who writes the final status?
Compute emits candidates. HCM writes the final status.
HCM owns the agent, skill group, task count, current status, and state-change log. If several services can write status independently, downstream systems will see competing facts.
The status enum looks like this:
1 | ONLINE(1000) |
When HCM consumes an exception candidate, it reads the current facts again and checks:
- Does the current status still match the rule?
- Does the current task count allow this transition?
- Is the agent in a covered skill group?
- Is this region allowed to send state changes?
- Has this exception already been notified or handled?
A rule can look like this:
1 | { |
The rule affects both the state transition and the notification. Compute configuration, Redis queues, and HCM rules all constrain the final behavior.
HCM’s responsibilities stay small and strict:
- Reject stale candidates.
- Recheck current facts.
- Write
status_table. - Write
unified_work_status_log. - Hand the state change to the downstream propagation path.
Version 4 introduces a state authority:
| Node / change | Problem it solves | Software engineering idea |
|---|---|---|
| HCM as writer | Multiple writers would create competing status facts | Single writer / source of truth |
| Status enum | Callers need stable state semantics | Explicit domain model |
| Rule coverage check | Rules apply to selected status, skill group, and business scope | Policy enforcement |
| Task-count recheck | Work assignment can change after Compute emitted the candidate | Consistency at commit time |
| Status log | State changes need auditability and downstream replay context | Append-only history |
How do downstream systems get the same state?
After HCM commits a status, WFM, routing, analytics, and other consumers still need the same fact.
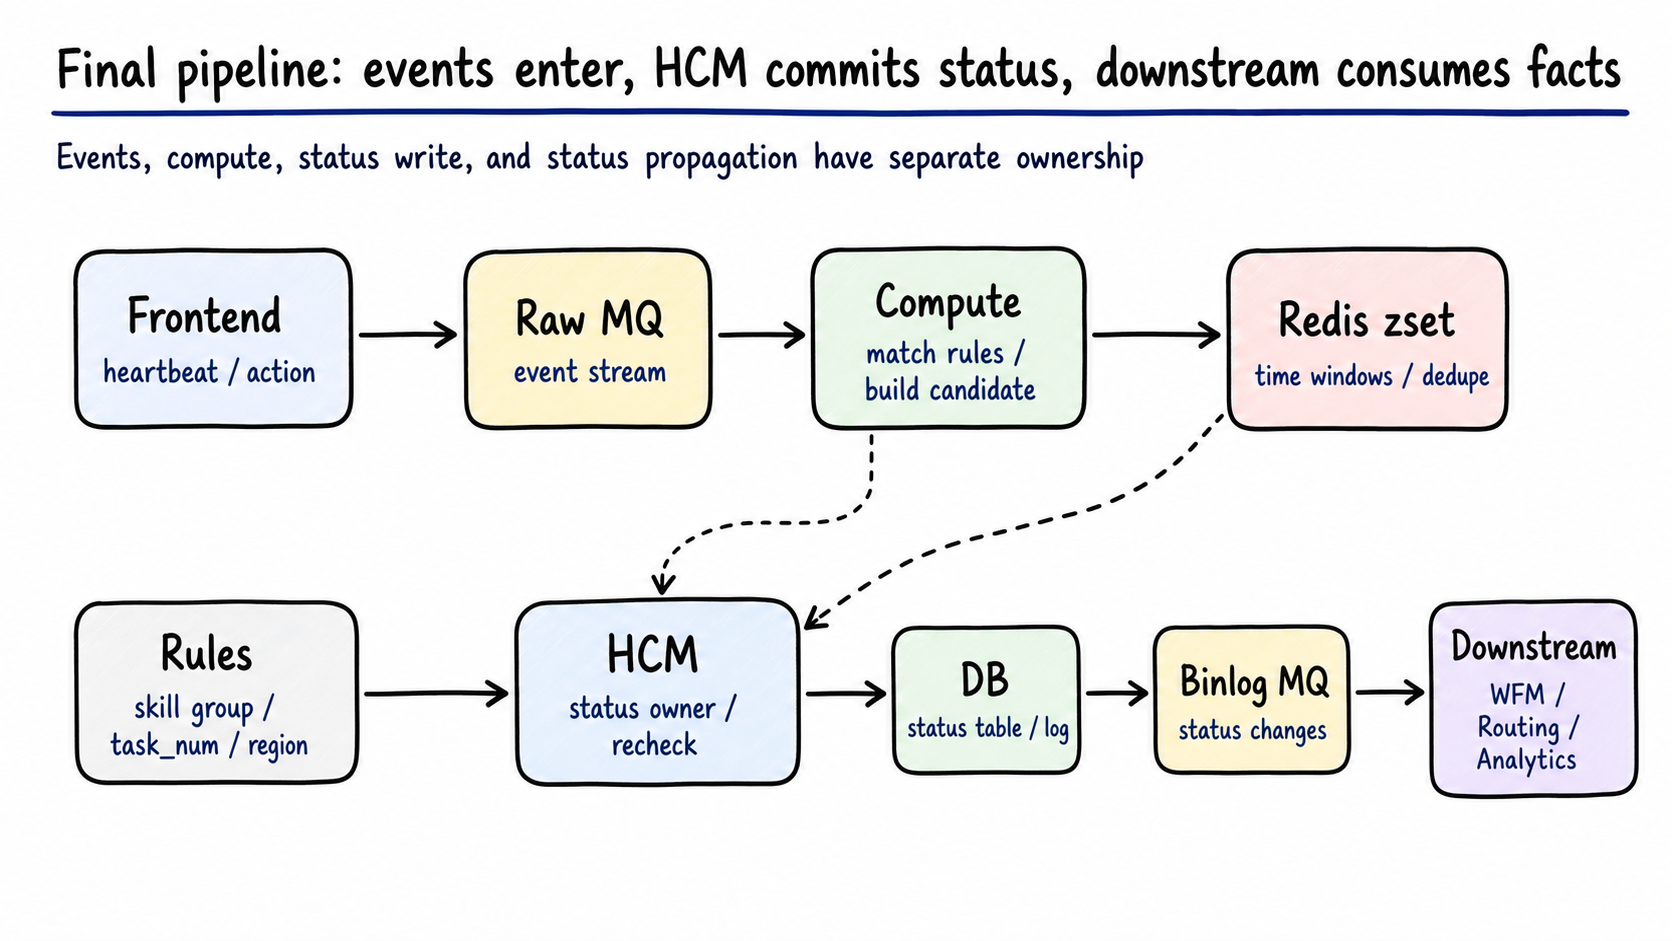
Figure 5: The single-region pipeline splits intake, candidate calculation, time windows, state commit, and downstream propagation. Generated by gpt-image-2.
The propagation path is:
1 | HCM UpdateWorkStatus |
This gives consumers a DB-backed fact stream. The cost is a longer path. A slow binlog handler, event dispatcher, MQ backlog, or downstream consumer can make users see stale state.
We hit that failure mode.
During one US-TTP incident, WFM’s omni-channel view did not show the current status. HCM DB already had the agent offline, and the HCM-to-WFM send path looked successful.
The real delay was earlier. The binlog-to-HCM-MQ path had about 300k messages queued. The work status handler was not the slow part. Another handler that depended on ES was timing out, and multiple handlers shared one consumption path. The slow handler dragged status propagation with it.
The fix direction was obvious after the incident: add handler-level latency metrics, and move work status propagation closer to a direct binlog-to-RMQ path so unrelated event distribution cannot block it.
The design question is simple: which handler can stall the state path, which consumer group shares a failure domain, and which metric proves the downstream view received the state?
The propagation part of Version 4 adds a second set of boundaries:
| Node / change | Problem it solves | Software engineering idea |
|---|---|---|
status_table |
Downstream systems need a committed fact, not a candidate | Durable source of truth |
| DBus / binlog | Consumers need to follow DB commits without coupling to write RPCs | Change data capture |
| Status change MQ | WFM and routing should consume state asynchronously | Event-driven propagation |
| Handler metrics | A slow handler can hide behind a successful DB write | Observability by stage |
| Consumer isolation plan | Unrelated handlers can block work status propagation | Failure-domain isolation |
How do events survive a region cutover?
The single-region pipeline works until disaster recovery and traffic cutover enter the picture.
Heartbeat events are the input to state calculation. If traffic moves to a target region before that region has recent Raw MQ events, Compute loses the time-window context. Agents can be marked no-action right after cutover, or abnormal calculation can pause until enough fresh context accumulates.
The first cross-region change is MQ mirror.
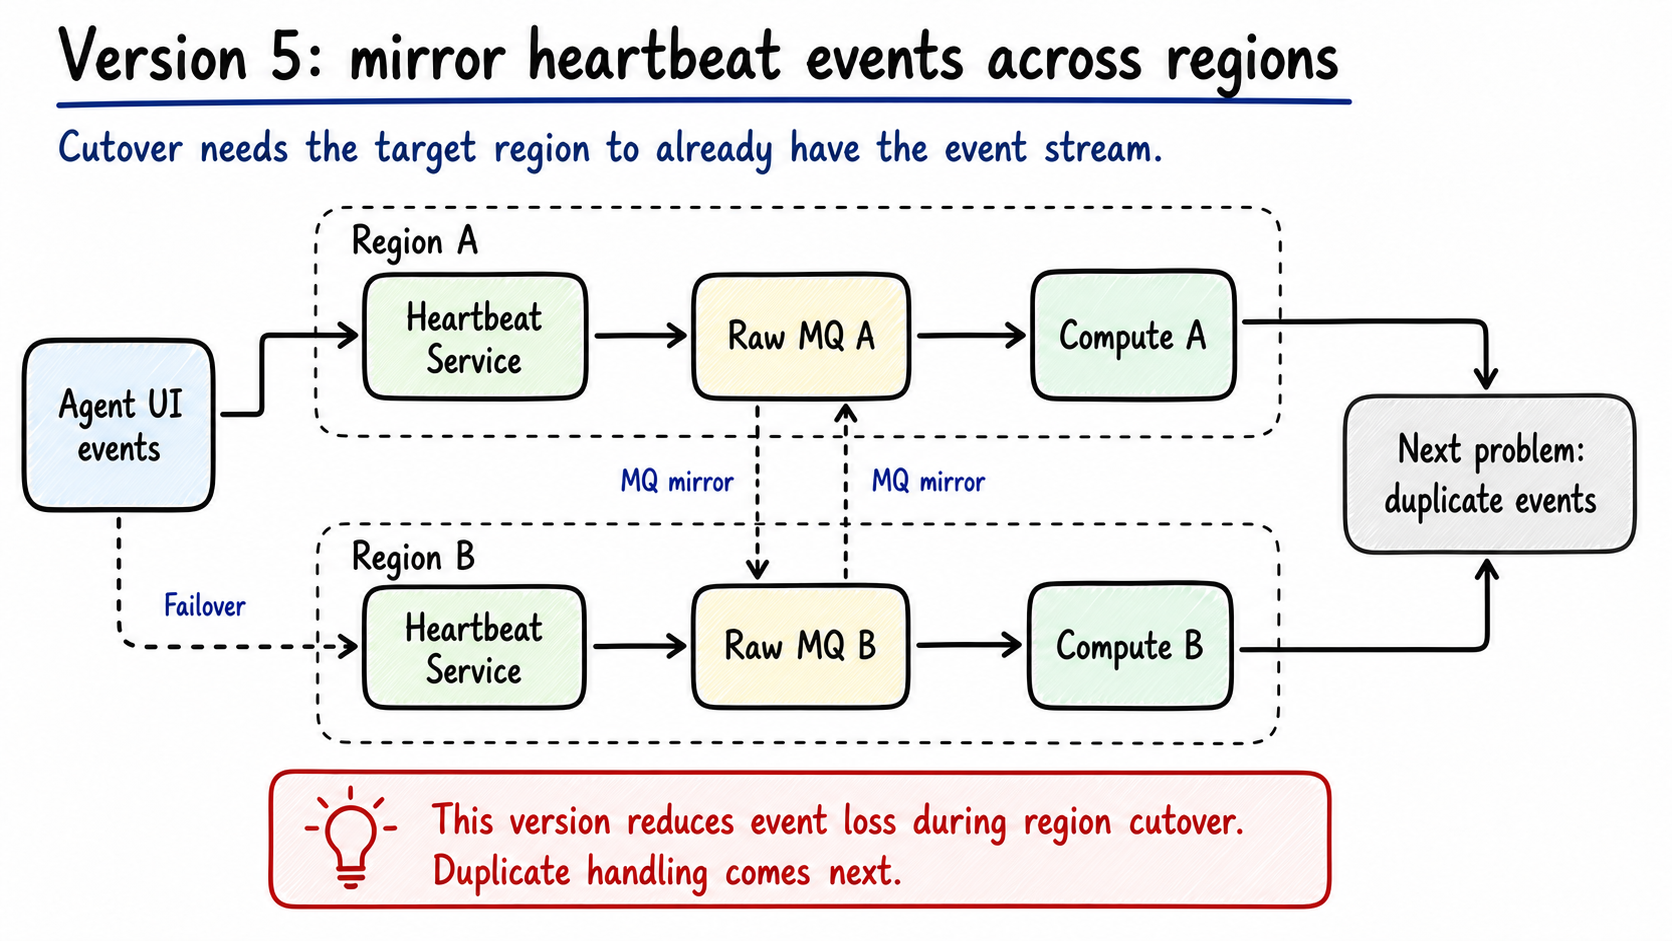
Figure 6: Raw MQ is mirrored between regions so the target region already has a consumable activity stream before it receives traffic. Generated by gpt-image-2.
Mirror protects event continuity:
1 | Region A Raw MQ <-> Region B Raw MQ |
Before cutover, both regions can see recent heartbeat events. When traffic actually moves, the target region is not starting from an empty queue. It already sees recent clicks, key events, heartbeats, ticket actions, and status events.
The cutover runbook then follows the data path:
- Check Heartbeat, HCM, Raw MQ, binlog MQ, and status MQ in the current region.
- Move a small traffic slice, for example 2%.
- Check
from_dcdimensions to verify the target region receives expected traffic. - Check mirrored Raw MQ lag, error rate, and consumption rate.
- If anything looks wrong, remove the routing config and cut traffic back.
MQ mirror reduces event loss. It also creates a new problem: two regions can see the same event.
Duplicate events are tolerable. Duplicate state changes are dangerous. The same no-action candidate emitted in two regions can send two exception messages to HCM, and downstream systems may receive repeated state changes.
That takes us to dedupe.
Version 5 adds event continuity across regions:
| Node / change | Problem it solves | Software engineering idea |
|---|---|---|
| MQ mirror | Target region needs recent activity before it receives traffic | Replicated log |
from_dc dimension |
Operators need to prove where traffic and events are flowing | Traceable provenance |
| Lag and consume-rate checks | Cutover should wait for the target stream to catch up | Readiness gate |
| Small traffic slice | Region changes need a reversible first step | Canary cutover |
| Rollback by routing config | Cutover failure should not require code rollback | Operational control plane |
How do we handle duplicates after mirror?
Duplicate control has two stages.
The sender side ensures only one region emits exception messages.
The state side makes HCM re-read current facts and apply idempotent checks before writing.
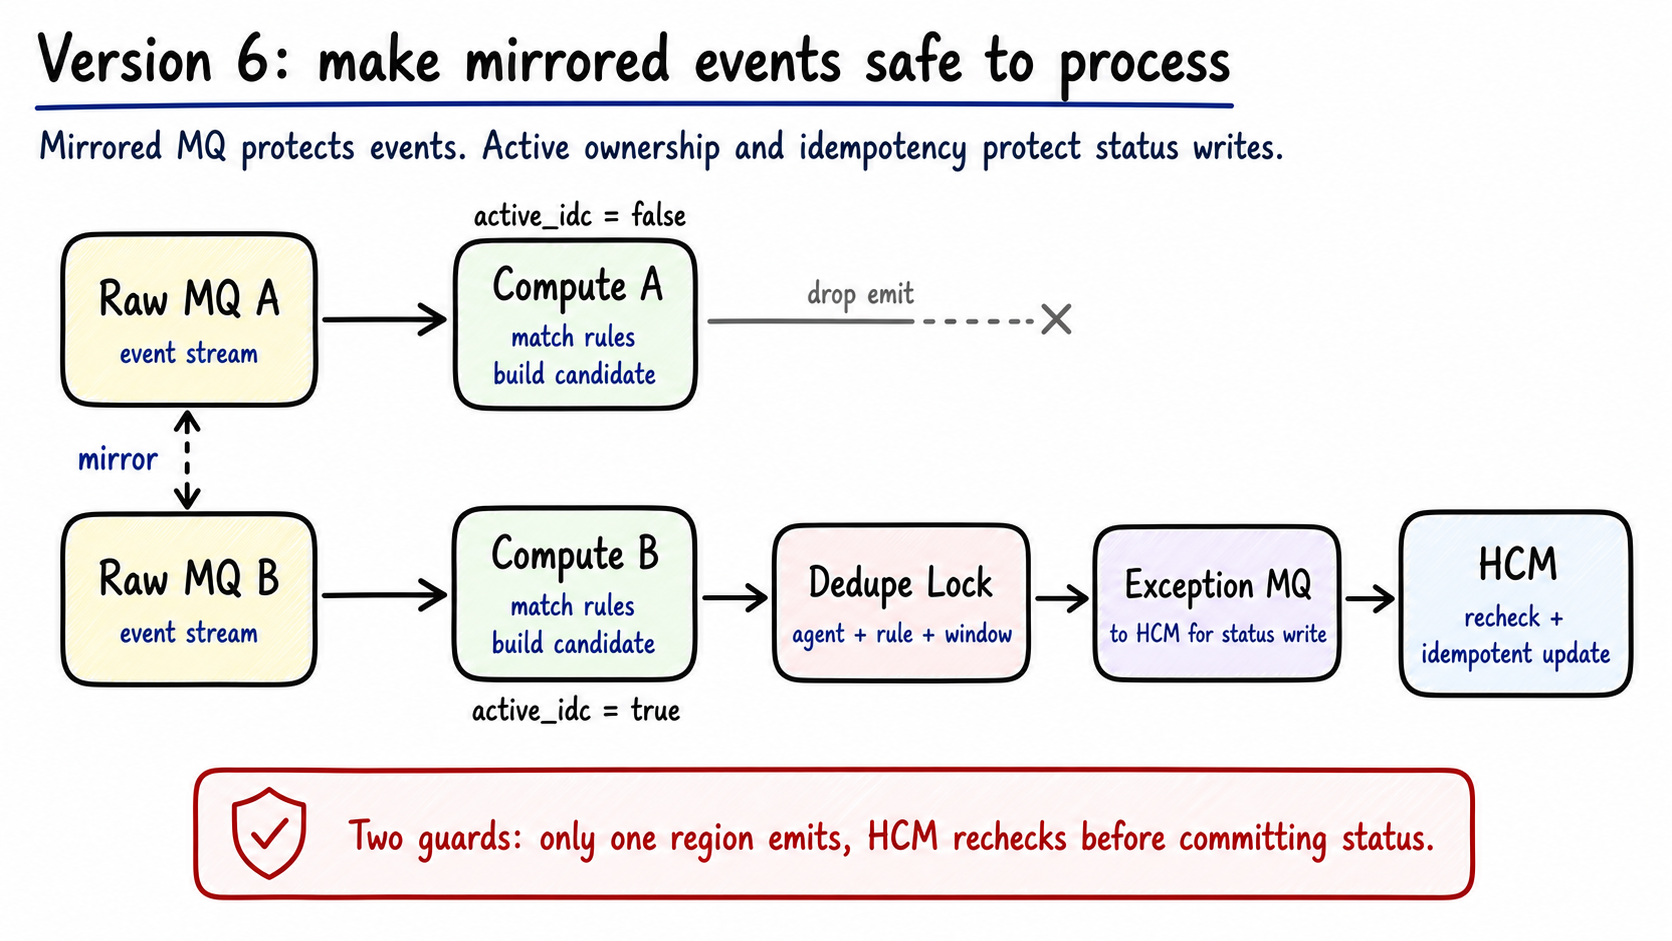
Figure 7: Mirror keeps events continuous, while active-region ownership and dedupe locks keep state changes single-writer. Generated by gpt-image-2.
Compute can consume mirrored events in both regions. Cron checks active_idc before emitting due candidates:
1 | active_idc = true -> can emit exception message |
Before sending, Cron also takes a dedupe lock. The lock must match the state transition boundary. Too broad, and unrelated rules block each other. Too narrow, and repeated messages for the same stage leak through.
A practical lock key is:
1 | agent_id + rule_id + window_start |
Redis zset helps collapse part of the duplicate input, because the same member written twice updates the score. The actual send path still needs the agent/rule/window lock.
HCM remains the final guard. When it receives an exception message, it re-reads current status, task count, skill group membership, and rule config. It writes status_table and unified_work_status_log only if the current facts still match the rule. If the agent already has a task, or the status changed through another path, HCM drops the candidate.
After cross-region support, the state path has three independent switches:
| Switch | Job |
|---|---|
| Traffic routing | Controls which region receives requests |
| MQ mirror | Controls whether events copy across regions |
active_idc |
Controls which region can emit exception status messages |
Keep those switches separate. Request routing, event replication, and state emission ownership often need different rollout and rollback timing.
Version 6 turns mirrored events into safe state changes:
| Node / change | Problem it solves | Software engineering idea |
|---|---|---|
active_idc |
Two regions can calculate, but only one should emit state changes | Leader ownership |
| Agent/rule/window lock | The same due candidate can be seen more than once | Idempotency key |
| HCM recheck | Duplicate or stale candidates should not commit stale state | Defensive write validation |
| Separate traffic / mirror / emit switches | Request flow, event replication, and write ownership change at different speeds | Orthogonal control planes |
How do we split TT and IES without breaking the old path?
The system later served both IES and TT business lines. Sharing HCM, Heartbeat, DB, MQ, and routing update paths tied release risk, capacity, and disaster recovery together.
The tempting split is to create TT HCM, TT Heartbeat, TT DB, and TT MQ, then move all TT upstreams in one shot.
That is a bad bet. HCM touches login, status update, skill groups, task count, routing, WFM, and binlog propagation. A field mismatch, filter bug, or consumer group mistake can affect dispatch and state sync.
The safer first phase is coexistence.
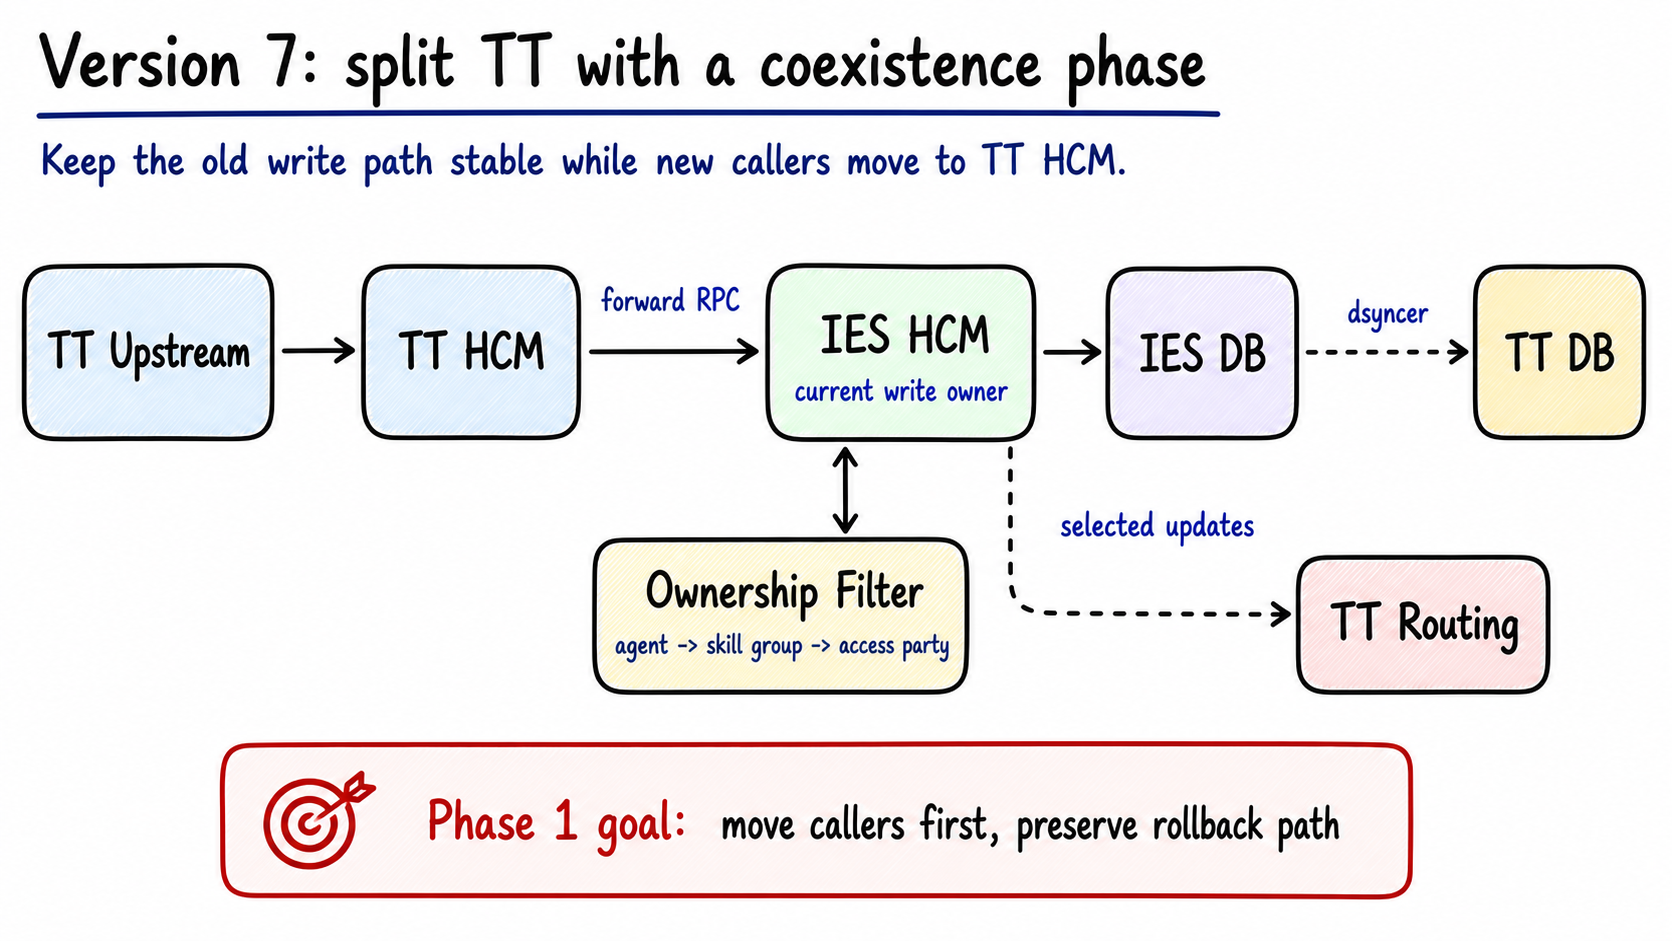
Figure 8: TT upstreams first move to TT HCM, while writes still land in IES HCM. Forwarding and dsyncer leave room for rollback. Generated by gpt-image-2.
The phase-one path is:
1 | TT upstream |
The goal is narrow: move the call entry point first, keep the write truth in the old path.
To let the old HCM know which data should also flow to TT, add an ownership filter:
1 | agent_id |
Cache the result in Redis. On cache miss, read DB, resolve access party, then write the cache. Work status, agent-skill-group relations, and routing updates can all use this ownership result.
This phase is rollback-friendly. If TT HCM has a problem, traffic can continue through the original IES path. If the filter has a problem, forwarding can be disabled by config while the old path keeps serving agents.
Version 7 is a migration bridge:
| Node / change | Problem it solves | Software engineering idea |
|---|---|---|
| TT HCM entry | Upstreams can move before the write path is fully split | Strangler pattern |
| Forward RPC to IES HCM | Old source of truth stays in charge during phase one | Compatibility adapter |
| Dsyncer | TT side can build a local read model while writes remain old-path | Data replication |
| Ownership filter | TT and IES data must be separated by agent ownership | Routing by domain ownership |
| Redis ownership cache | Ownership checks are hot and repeated | Read-through cache |
| Config kill switch | Migration needs rollback without redeploy | Feature flag / rollback lever |
When can the split become real?
After coexistence is stable, the second phase separates writes, events, MQ, and routing updates.
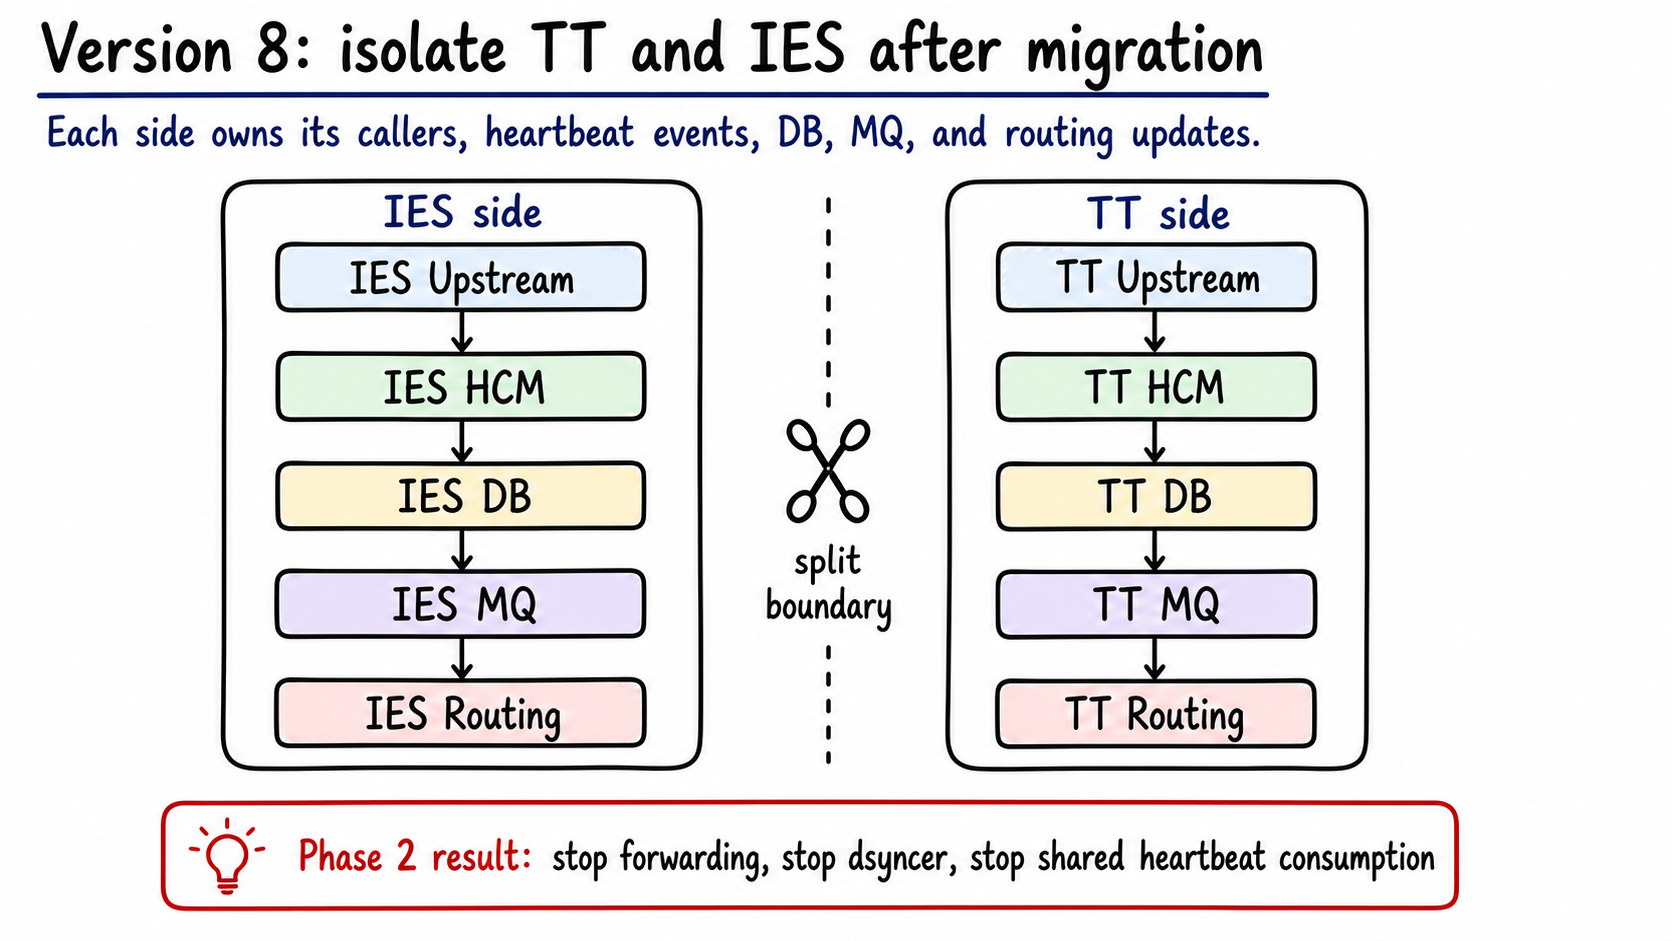
Figure 9: After the split, TT and IES own separate upstream, HCM, DB, MQ, and routing update paths. Generated by gpt-image-2.
The split includes:
- TT HCM stops forwarding RPCs to IES HCM.
- The IES-to-TT dsyncer stops.
- IES heartbeat and MQ stop consuming TT agent messages.
- TT routing consumes only TT status updates.
- IES routing consumes only IES status updates.
After that, the old HCM path sheds about 3,000 agents and about 2,000 QPS.
There are two things to prove: the services are separated, and the state facts are closed inside each side.
- TT agent heartbeat enters only the TT side.
- TT agent status is committed only by TT HCM.
- TT status changes go only to TT routing, WFM, and data consumers.
- IES keeps its original path without TT release and cutover risk.
Only then is the split actually done.
Version 8 removes the bridge after ownership is proven:
| Node / change | Problem it solves | Software engineering idea |
|---|---|---|
| Stop forwarding | TT writes should no longer depend on IES availability | Service ownership |
| Stop dsyncer | Dual-write/read-model sync should not stay forever | Temporary migration artifact removal |
| Separate TT / IES MQ | Events should stay inside their owning business line | Bounded context |
| Separate routing consumers | Routing updates should not cross ownership boundaries | Consumer ownership |
| Closure checks | A split is done only when facts and side effects are local | Invariant verification |
How do we notice when frontend activity stops entering the system?
State calculation depends on input events. Green backend RPC metrics only prove backend services are alive. They do not prove user activity reached Heartbeat.
After one GCP-to-NO1A cutover, agents frequently became abnormal while they were still working in the workbench. The failure was in long-link configuration: keyup and keydown events were not reliably entering Heartbeat.
HCM error rate could not see that part of the input path. We needed input health before state calculation.

Figure 10: Before calculating state, the system verifies that user activity enters through Workbench SDK, WS-API, Frontier, Heartbeat intake, and Raw MQ. Generated by gpt-image-2.
Input health needs several dimensions:
| Metric | Why it matters |
|---|---|
event_rate{event_type, region, channel} |
Detect drops in click, key, heartbeat, and other activity events |
client_lag |
Measure delay from client action to server intake |
frontier_error_rate |
Detect long-link channel failures |
ws_register_failure |
Detect module/entity registration failures |
short_poll_lag |
Check whether short-link compensation keeps up |
raw_mq_lag |
Detect backlog after events enter MQ |
synthetic_action |
Send scheduled synthetic actions per region to prove the path works |
no_action_ratio |
Detect abnormal candidates concentrated by region, version, or channel |
The stronger design feeds input health into the rule layer.
If one region or workbench version has unhealthy input, automatic abnormal rules should degrade: extend the window, pause auto-abnormal, or send reminders only. When input recovers, normal calculation resumes.
That reduces automation during incidents, but it prevents a worse failure: marking working agents abnormal because the collection path broke.
Version 9 adds input observability:
| Node / change | Problem it solves | Software engineering idea |
|---|---|---|
| Input health metrics | Backend success does not prove frontend actions arrived | End-to-end observability |
frontier_error_rate / ws_register_failure |
Long-link and registration failures need their own signals | Layer-specific telemetry |
short_poll_lag |
Degradation path must be measured too | Fallback observability |
| Synthetic action | Passive metrics may miss a broken path with low traffic | Active probing |
| Rule degradation | Bad input should reduce automation before it creates bad state | Circuit breaker for business rules |
What if HCM is correct and downstream is stale?
Once HCM commits a status, downstream systems still need to receive it. This was the US-TTP ES incident in another form: HCM DB had the correct offline state, but WFM still displayed the old state.
The binlog-to-HCM-MQ path had about 300k queued messages. The work status handler was not slow. An ES-dependent handler timed out and blocked shared consumption.
The design response is to give state propagation its own lane.
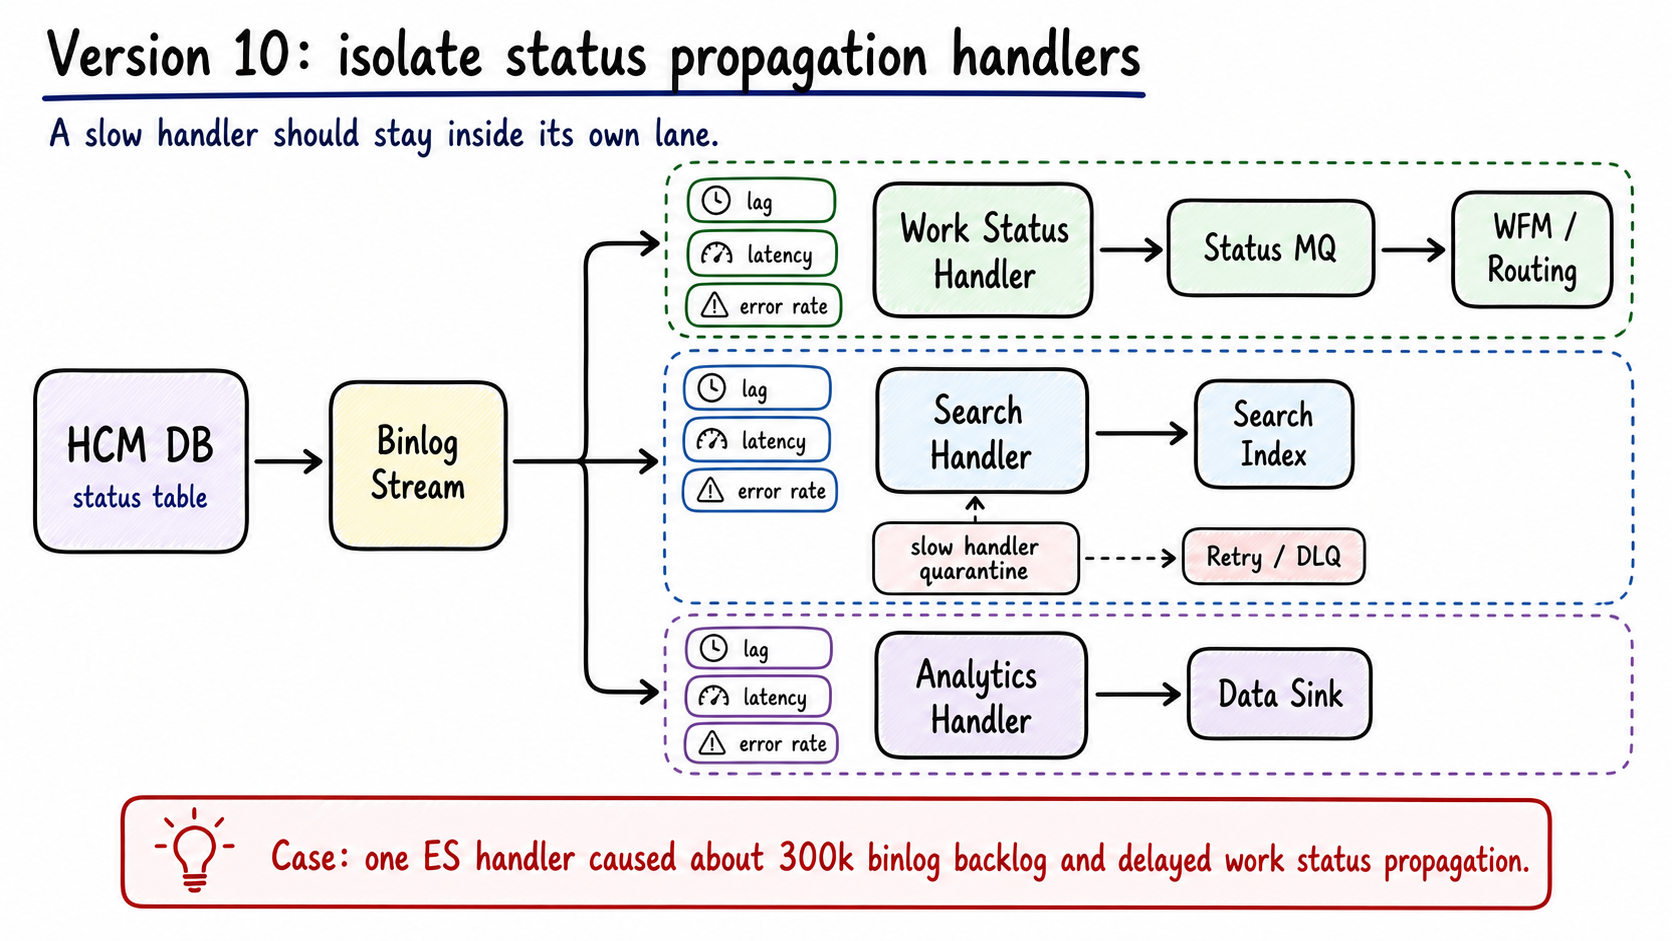
Figure 11: Binlog consumers are split by business meaning. A slow search handler no longer blocks work status delivery to WFM and routing. Generated by gpt-image-2.
The target shape treats status change as a first-class event:
1 | HCM transaction |
status_change_outbox is written in the same transaction as the status update. The dispatcher only delivers outbox status events to the status MQ.
Search, analytics, and audit can keep consuming binlog or subscribe to their own event streams. They should not share the same blocking point as work status propagation. Slow handlers get their own retry and DLQ.
End-to-end metrics need to follow the same split:
| Metric | Meaning |
|---|---|
status_commit_to_mq_latency |
HCM DB commit to status message send |
mq_to_wfm_latency |
Status MQ to WFM consumption |
handler_lag{handler} |
Backlog per handler |
handler_error_rate{handler} |
Error rate per handler |
downstream_state_age |
Age of the state seen by downstream compared with HCM commit |
The worst state-system failure is a correct source of truth with stale consumers. Split commit, outbound delivery, and consumption, then measure each segment.
Version 10 isolates propagation:
| Node / change | Problem it solves | Software engineering idea |
|---|---|---|
status_change_outbox |
DB commit and outbound event should succeed or fail together | Transactional outbox |
work_status_dispatcher |
Work status should not wait behind unrelated handlers | Dedicated worker |
| Handler-specific retry / DLQ | Slow consumers need isolated recovery paths | Bulkhead isolation |
| End-to-end latency metrics | Stale downstream state must be traced to a segment | Pipeline observability |
| Reconciliation direction | Downstream state can drift from HCM facts | Eventual consistency repair |
How do we keep hot status reads from taking HCM down?
GetWorkStatus is a hot read in this pipeline. Compute calls it. Upstreams call it. During one OOM incident, downstream error rate spikes aligned with GetWorkStatus traffic spikes.
The state system needs a capacity guard.
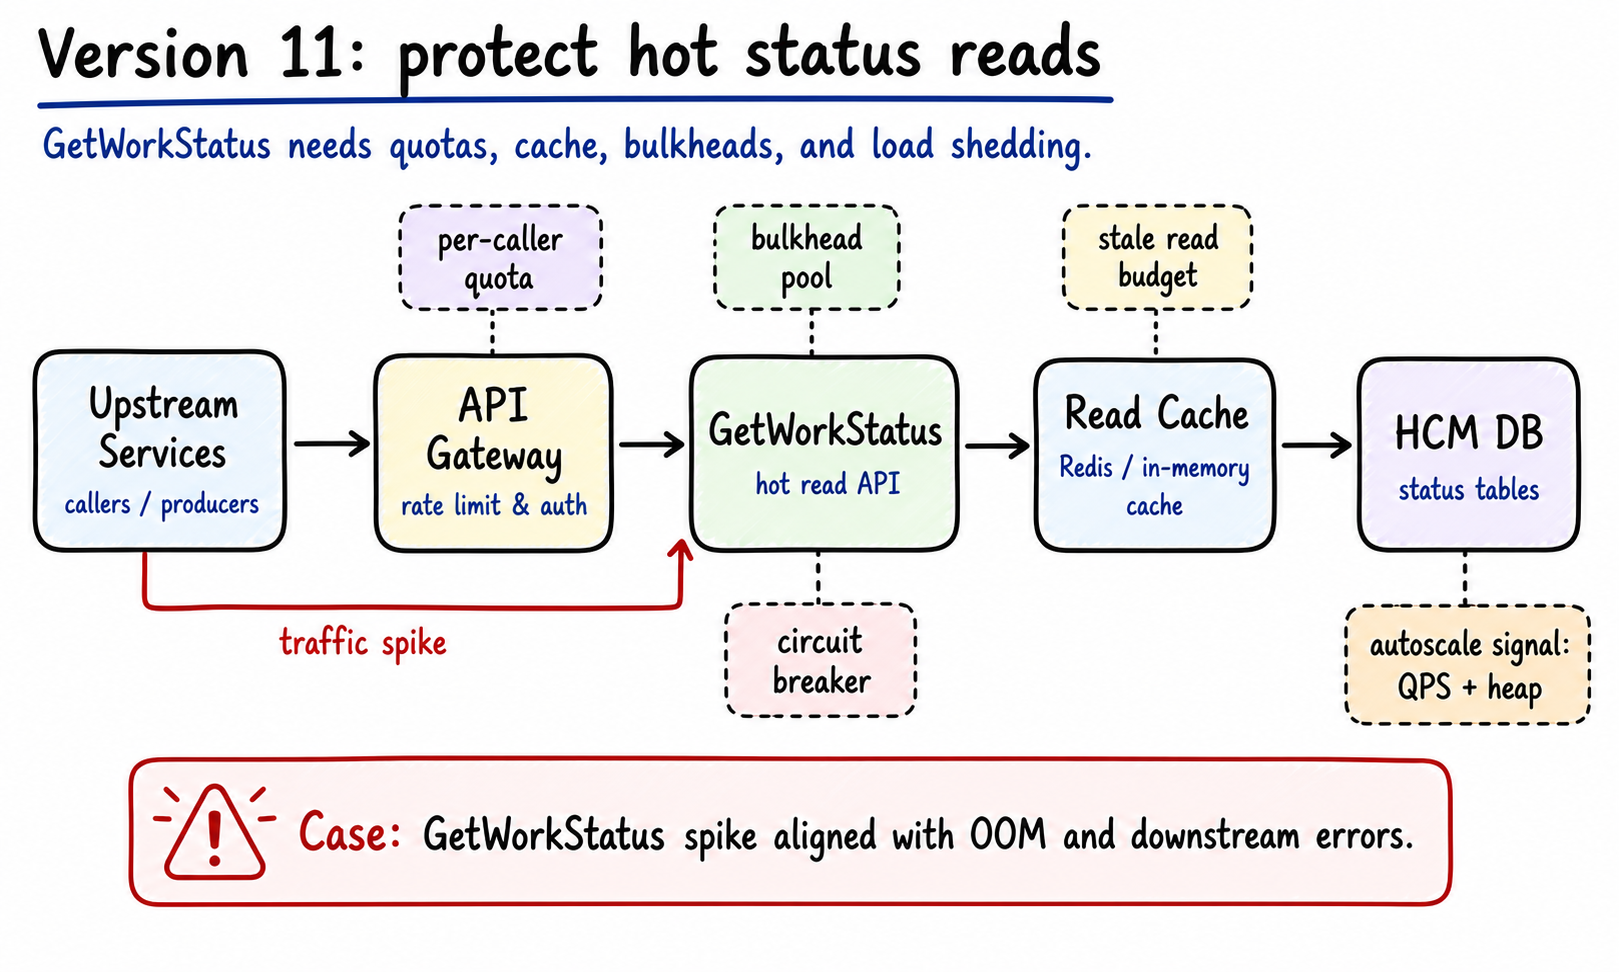
Figure 12: GetWorkStatus gets quota in front, caller isolation inside, and short-TTL cache plus autoscaling signals behind it. Generated by gpt-image-2.
The goal is caller isolation. If one upstream goes bad, its failure should stay inside its budget.
GetWorkStatus needs several defenses:
| Defense | Job |
|---|---|
| Per-caller quota | Limit one abusive upstream first |
| Bulkhead pool | Separate Compute, WFM, admin, and other callers |
| Read cache | Short-TTL cache for repeated reads |
| Stale read budget | Allow slightly stale reads on non-write paths |
| Circuit breaker | Fail fast when DB or dependencies are unhealthy |
| Autoscale signal | Scale by QPS, heap, GC, and p99 latency |
Heartbeat Compute should also reduce pressure. If the same agent reports many events in a short window, Compute does not need to call GetWorkStatus for every event. It can merge by agent in a small window, read a local or Redis snapshot, and still let HCM recheck before final commit.
The path changes from “every caller hits DB-shaped truth” into a read service with budgets, isolation, and degradation.
Version 11 turns a hot read into a protected service:
| Node / change | Problem it solves | Software engineering idea |
|---|---|---|
| Per-caller quota | One upstream can overwhelm shared state reads | Fairness and admission control |
| Bulkhead pool | Caller groups should not exhaust each other’s workers | Bulkhead isolation |
| Short-TTL cache | Repeated reads should not all hit DB | Cache-aside |
| Stale read budget | Some reads can trade freshness for availability | Explicit consistency budget |
| Circuit breaker | Broken dependencies should fail fast | Failure containment |
| Compute-side merge | Many events for one agent can collapse into fewer reads | Request coalescing |
How do query changes ship safely?
One HCM 4.3 rollback exposed a release problem.
Canary looked fine. After ROW, new error logs appeared. Two LEFT JOINs amplified a count SQL path and caused DB timeouts.
Canary alone did not cover this class of failure. Canary traffic is smaller and its data distribution may be kind. Expensive queries need their own cost gate.
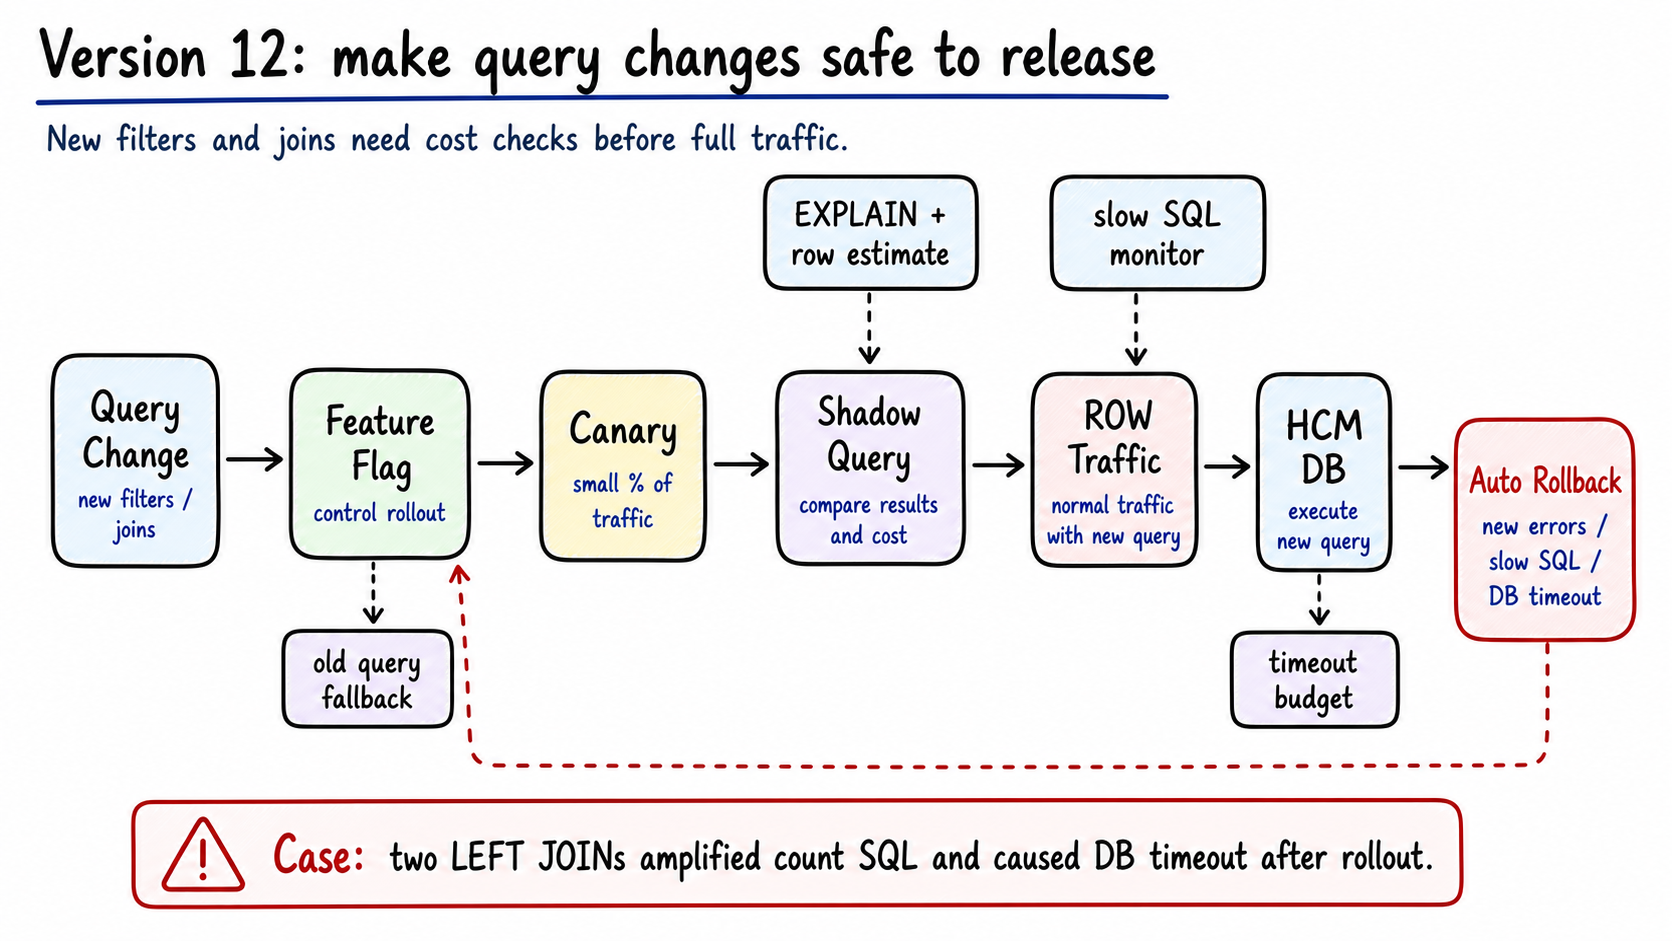
Figure 13: Query changes pass through feature flags, canary, shadow query, EXPLAIN checks, slow SQL monitoring, and rollback gates. Generated by gpt-image-2.
A query rollout can follow this path:
1 | query change |
shadow query does not affect online response. It compares result and cost. The release system watches:
| Signal | Action |
|---|---|
EXPLAIN row estimate over budget |
Block release |
| Shadow query result mismatch | Block release |
| p99 query latency over budget | Degrade or rollback |
| New error logs | Rollback |
| DB timeout increase | Rollback |
Feature flags should be finer than “use new query.” A better split is by filter shape:
1 | simple filter -> old query |
If a complex filter path breaks, only that path rolls back.
Version 12 adds release gates around data access:
| Node / change | Problem it solves | Software engineering idea |
|---|---|---|
| Feature flag | Query behavior needs runtime rollback | Progressive delivery |
| Canary | New query should see a small traffic slice first | Controlled exposure |
| Shadow query | Result and cost can be checked without affecting users | Dark launch |
EXPLAIN budget |
Expensive query plans should be blocked before traffic | Static cost guard |
| Slow SQL and error budgets | Runtime cost can differ from canary expectation | Automated rollback signal |
| Filter-level fallback | One expensive filter should not roll back every query path | Granular kill switch |
What remains open?
By this point, the heartbeat design has become a state platform. Intake, compute, commit, propagation, capacity, release, and ownership boundaries can each be observed and degraded separately.
There is still more to build:
| Question | Extension |
|---|---|
| How do we verify more rules? | Build a rule simulator that replays historical events and reports how many agents a new rule would affect |
| How do we debug one wrong status quickly? | Build a per-agent timeline across input events, candidates, zsets, HCM commits, and downstream consumption |
| Can multi-region ownership split-brain? | Drill active_idc switchovers and compare duplicate messages and missing messages |
| What if downstream stays stale for too long? | Add reconciliation jobs that compare WFM/routing state against HCM facts |
| Can read cache return stale data in dangerous paths? | Add versioned cache values and stale-read budgets, while keeping write paths closed by HCM recheck |
Final design
The original question was simple: how do we know whether an agent is online?
The final design has two planes.
The data plane turns user activity into state facts:
1 | Agent UI |
The control plane keeps the data plane bounded during failure:
- The frontend reports activity and heartbeat events.
- Workbench SDK owns the long-link singleton, reconnect, short-link compensation, and client-side dedupe.
- Input health proves activity reached Heartbeat.
- MQ mirror preserves event continuity across regions.
- Redis zset and dedupe locks collapse repeated candidates.
active_idcdecides which region can emit exception messages.- HCM recheck closes the final status commit.
- Outbox and handler isolation protect work status propagation.
- Quota, cache, bulkheads, and circuit breakers protect hot reads.
- Query gates control risky SQL changes.
- TT/IES ownership separates agent, skill group, MQ, and routing boundaries.
The design is much larger than last_seen_at, but each layer earns its place. A heartbeat system that drives routing and workforce management is not a ping loop. It is an event intake system, a time-window calculator, a state authority, a propagation pipeline, a multi-region failover path, and a set of release and capacity guardrails around the same fact: what state is this agent in right now?