I recently moved to a new team working on Southeast Asia TikTok Shop marketing and user growth. I had not worked as a growth engineer before, so I used the team’s existing projects and GPT to learn the area. The biggest thing I learned is that data is one of the most important things in growth engineering. These are my notes from that learning process, written by hand.
Engineering and drawing pages are two different things, and they produce different results.
Many engineers follow a product idea, add a module to the homepage, or add a popup at some transaction step, but they do not know why they are doing it. The result is often poor, and the benefit is hard to verify. An engineering approach is closer to debugging: find where the user drops, where the user gets stuck, and why the user fails to convert into transaction value. Then optimize that step and use an experiment to verify whether the optimization meets the expectation.
The most important value an engineer brings to growth work is turning a business idea into a verifiable causal chain.
Take ecommerce as an example. The core metric is GMV, gross merchandise value. Suppose your manager says GMV is below the industry average and needs to increase by xx%. You get busy. You guess that the homepage does not show enough campaign information, so you add a campaign module. What happens? GMV does not increase much. Even if it does increase, Zihan and Liming may also be shipping features at the same time. It is hard to explain that the GMV increase came from your change.
The reason is that GMV is a highly abstract metric. Its rise or fall is the combined result of many factors. You do not know whether the cause is product quality, price, system performance, or something else. If you make decisions only from this top-level number, your change may miss the root cause. It is the same as debugging a long chain without logs. If you only look at the final result and guess the root cause, efficiency is low.
A better approach is to turn the whole growth process into a verifiable system: use data to drive decisions, verify decisions, and measure impact.
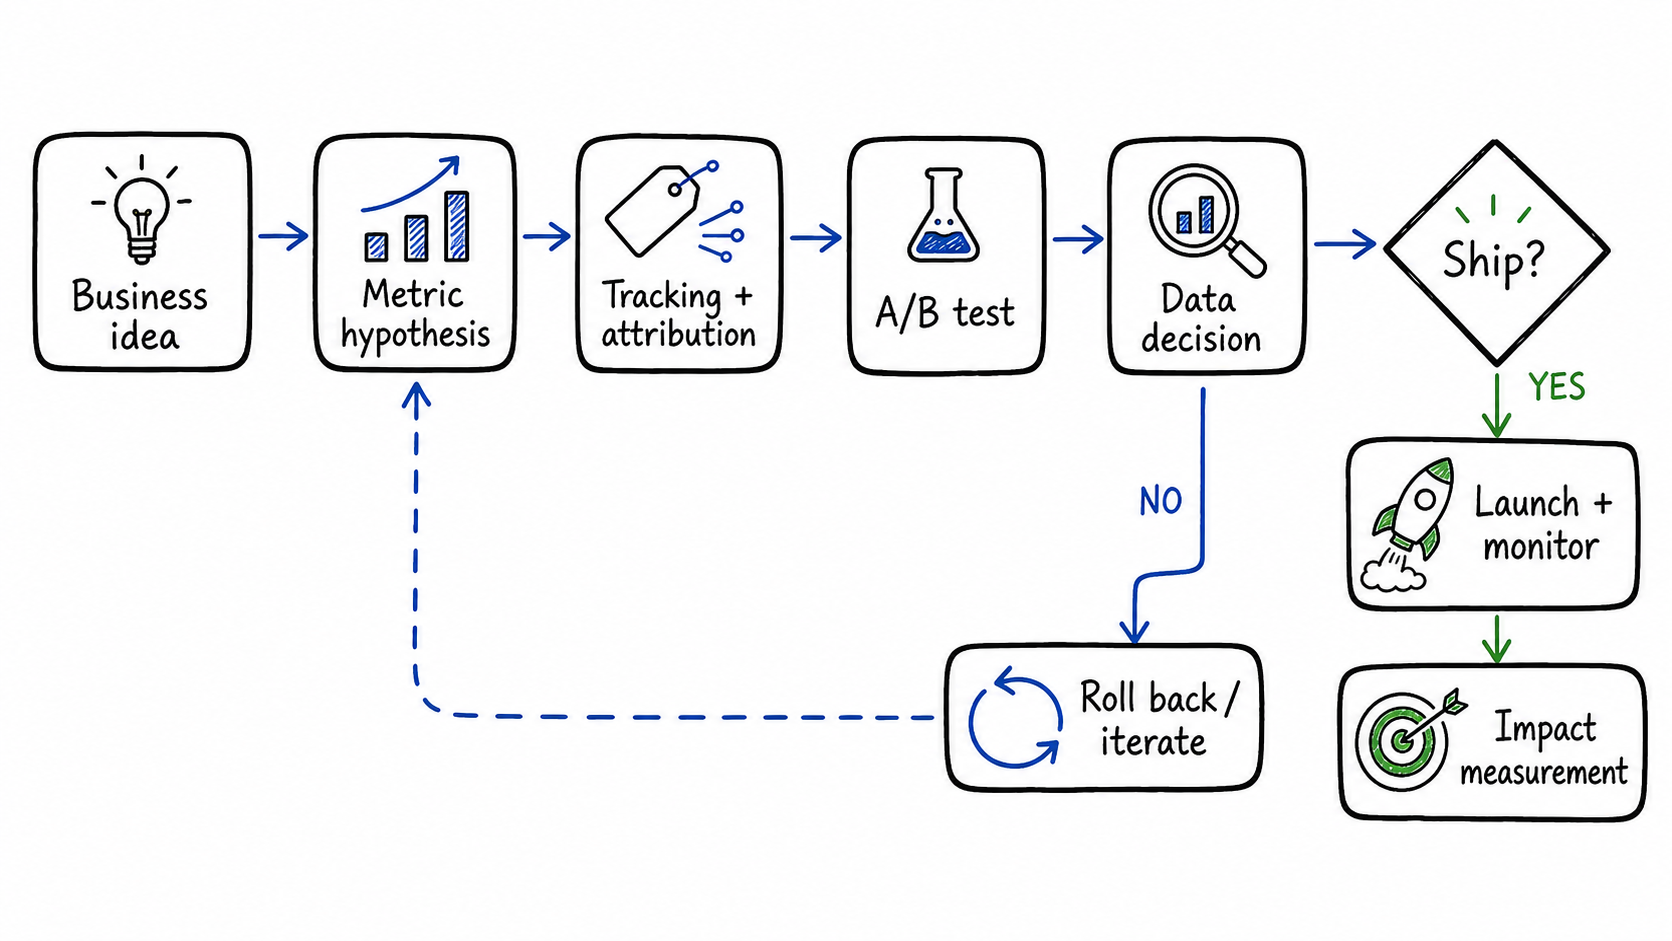
Figure: Growth engineering validation loop. A business idea becomes a metric hypothesis, tracking design, experiment, decision, and impact measurement. generated by gpt-image-2.
Ecommerce growth data engineering
Below I use ecommerce growth engineering, the kind of project I work on, to explain how data-driven growth engineering works.
Node decomposition
The final metric for ecommerce transactions is GMV. It represents the transaction scale generated on the platform. It is highly abstract. Other metrics only affect it indirectly.
Engineering decomposition
To make analysis easier, we can break the metric down by process.
To increase GMV, we need as many users as possible to reach a successful transaction with a high enough average order value. We can turn this process into a sequence of metrics, track the user count at each important step, and form a funnel:
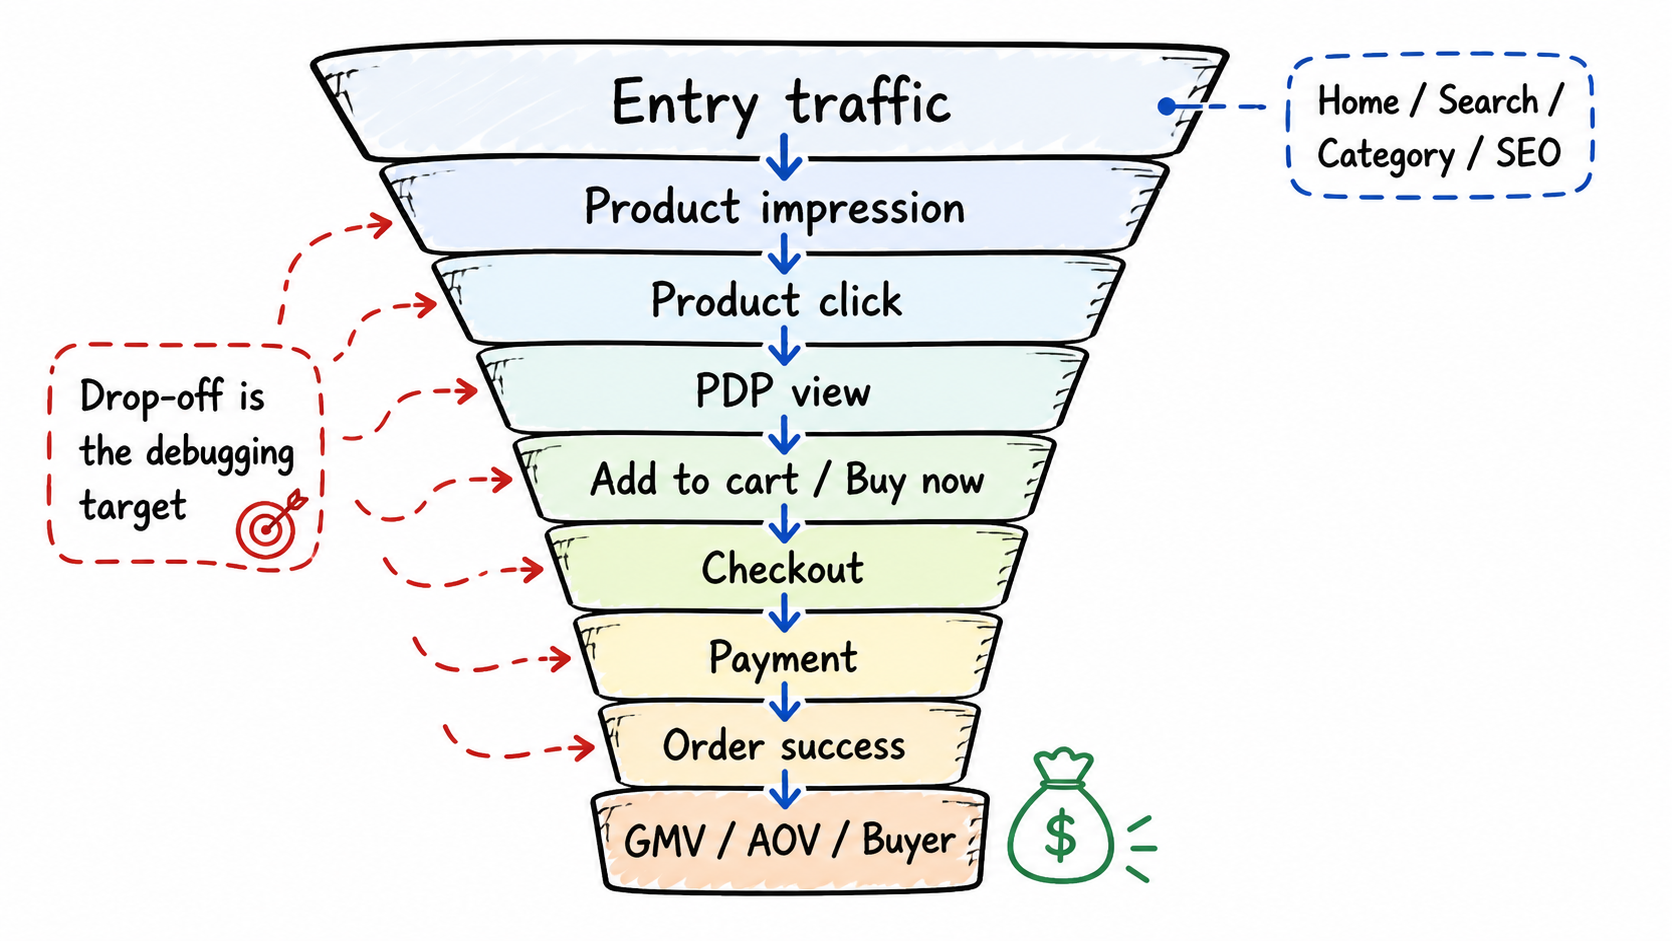
Figure: Ecommerce conversion funnel from entry traffic to order success and GMV. generated by gpt-image-2.
We can divide downstream users by upstream users to get each step’s conversion rate. UV, the starting user count, multiplied by all conversion rates becomes GMV:
Each layer has a different meaning:
| Stage | Metric | A drop usually means |
|---|---|---|
| Entry exposure -> product click | CTR | Module position, visual design, benefit point, or product relevance is not enough |
| Product click -> PDP | Arrival rate | Navigation failure, poor performance, unavailable product, or missing tracking |
| PDP -> add to cart / buy now | Purchase intent | Price, stock, shipping fee, coupon, review, or trust issue |
| Checkout -> Payment | Transaction friction | Login, address, payment method, extra fee, or risk control |
| Payment -> Order | System chain | Payment callback, stock lock, order service, or idempotency issue |
Operating decomposition
We can also break it down from the user operating perspective, to understand which user group’s GMV is rising or falling and which lever should be pulled.
By new and existing users, or by region and age:
Then we can judge who caused the GMV change:
1 | Existing user activity drops -> retention / recall problem |
Connecting the nodes
Breaking down nodes helps us see where user loss is largest and helps us find the root cause. But a root cause is not enough. We also need to ensure that the fix eventually affects the final target, GMV. That means the whole chain must be connected in the data. For example, when a user opens the homepage, we need to know whether this visit enters a PDP, whether it places an order, and whether it contributes GMV.
Without that connection, it is easy to reach the wrong decision. If we only care about the conversion from homepage open to product detail page, the extreme solution is a redirect: once the user enters the homepage, we automatically jump to a product detail page. That makes the conversion rate 100%, but it will almost certainly damage GMV.
The same applies to some app download tactics. Downloads may increase on the surface, but if they do not help users place orders or become retained users, ROI is still very low.
So a feature change should be guided by whether it can transmit value to GMV, not by one local step metric.
Several analysis methods
Funnel analysis
Funnel analysis answers: “At which step did users drop?”
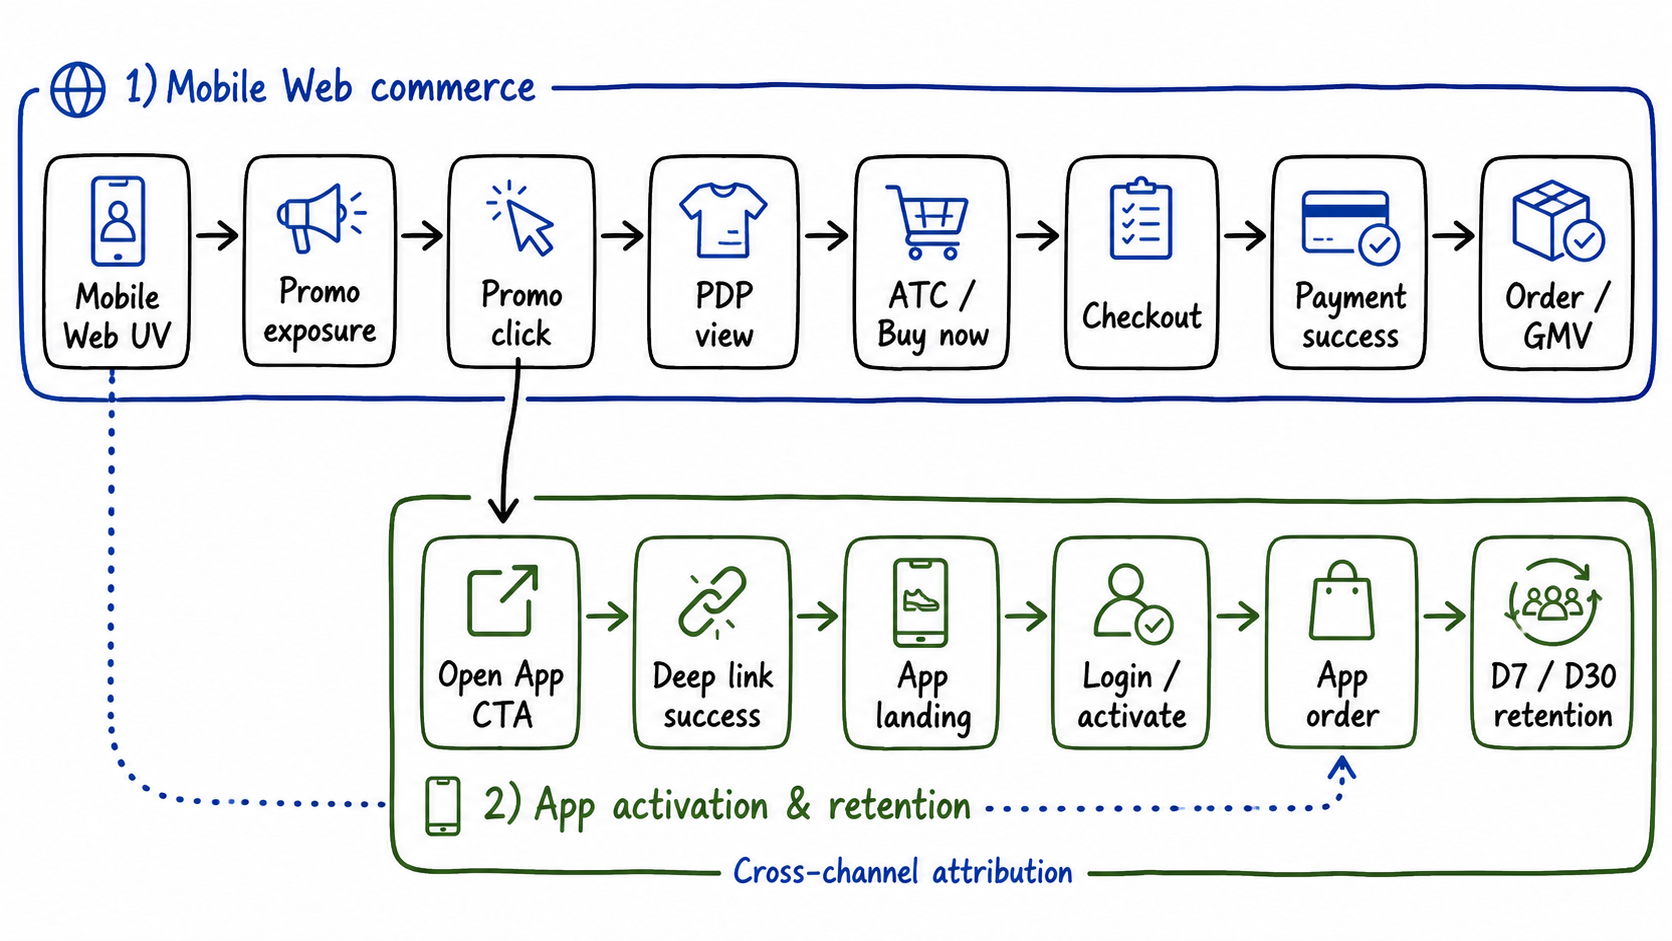
Figure: Web and app growth path. A promo click can continue through web checkout or branch into app activation, order, and retention. generated by gpt-image-2.
Funnel analysis mainly locates responsibility:
- Low CTR: frontend display, campaign benefit point, product ranking, recommendation strategy.
- Low PDP arrival: navigation, performance, product status, deeplink, tracking.
- Low PDP add-to-cart: price, stock, promotion, review, trust.
- Low checkout payment: login, address, payment, shipping fee, risk control.
- Low first order after app open: inconsistent landing, benefit gap, login friction, lost product context.
Cohort / retention analysis
Cohort analysis answers: “What happened to this group of users later?” You cannot rely on same-day app opens alone, because many clicks are accidental or low-quality traffic.
1 | Group by the date the user enters the app: |
If an A/B plan increases app opens by 20%, but D7 retention and first order do not improve, that is not good growth. It is traffic transport.
Attribution analysis
Attribution answers: “Who should get credit for this GMV?”
Common models:
| Model | Meaning | Risk |
|---|---|---|
| Last Click | The last click takes the credit | Easily overestimates the final touchpoint |
| First Click | The first touchpoint takes the credit | Easily overestimates the entrance |
| Linear | Multiple touchpoints split the credit | Simple but rough |
| Time Decay | The closer to purchase, the higher the weight | Still correlation, not causation |
A/B Test
A/B answers: “Did this change cause the result?”
A qualified experiment must have:
- Primary Metric: only one, used to decide win or loss. For example, Web-assisted App GMV per UV, order conversion rate, or buyer rate.
- Secondary Metrics: explain why it wins or loses. For example, CTR, PDP arrival rate, add-to-cart rate.
- Guardrail Metrics: metrics that cannot be harmed. For example, LCP, CLS, bounce, refund rate, complaints, other-channel GMV.
- Stable Randomization: bucket by user or device stably. Do not change the group every refresh.
- Enough Sample Size: do not draw conclusions when samples are insufficient.
- Run Full Cycle: cover a full business cycle. Ecommerce usually cannot run for only half a day.
- No Peeking: stopping the experiment halfway because the number looks good is error-prone.
- SRM Check: if experiment/control traffic ratio is abnormal, the result is not trustworthy.
An example:
1 | Experiment: show an app landing page when MWeb users click purchase |
Full case: use App Landing after MWeb purchase click
The sections above covered GMV decomposition, funnels, attribution, retention, and A/B. If these concepts are viewed separately, they still feel scattered. Below is a real project scenario that connects them and shows how data-driven decisions work.
Idea: after Toko Mobile Web users click purchase, should we use an App Landing Page to guide them into the app to finish the purchase?
1. Business problem
From the data, Toko has a typical structural problem:
- Toko Web: DAU is high and stable, but GMV is low.
- Toko App: GMV is high, but DAU is declining.
This means Web may carry a lot of product browsing, SEO, search, and campaign entry traffic, but it has not converted that traffic into transactions well. Mobile Web is especially suitable for app guidance when users browse products on their phones, because the app usually has better login state, payment experience, benefit continuity, and repurchase capability.
But the current problem is that Web has an app banner, yet the banner lacks a clear scenario and user motivation. Users do not necessarily feel they should tap just because they see “open app.” A better scenario is: when a user has clicked Buy Now or shown purchase intent, use a landing page to explain that opening the app can preserve the current product, keep the current benefit, and continue the purchase.
So this project needs to verify:
Can high-intent MWeb users be converted through better app landing into app first order, retention, and long-term GMV?
Business hypothesis
The hypothesis behind this requirement can be split into three layers:
Hypothesis 1: there is a group of high-purchase-intent users on MWeb.
Evidence: they clicked Buy Now / Add to Cart / coupon claim / Flash Sale product.
Hypothesis 2: the current Web -> App guidance efficiency is low.
Reasons: generic banner, weak motivation, incomplete deeplink handoff, product / coupon / price context may be lost.
Hypothesis 3: if App Landing is used after purchase intent happens.
Result: app open rate, login rate, first order rate, later retention, and GMV will improve.
Metric chain
The complete metric chain for this project should be:
The diagram below splits MWeb eligible UV to D30 GMV / LTV into Web intent and App value.
Funnel:
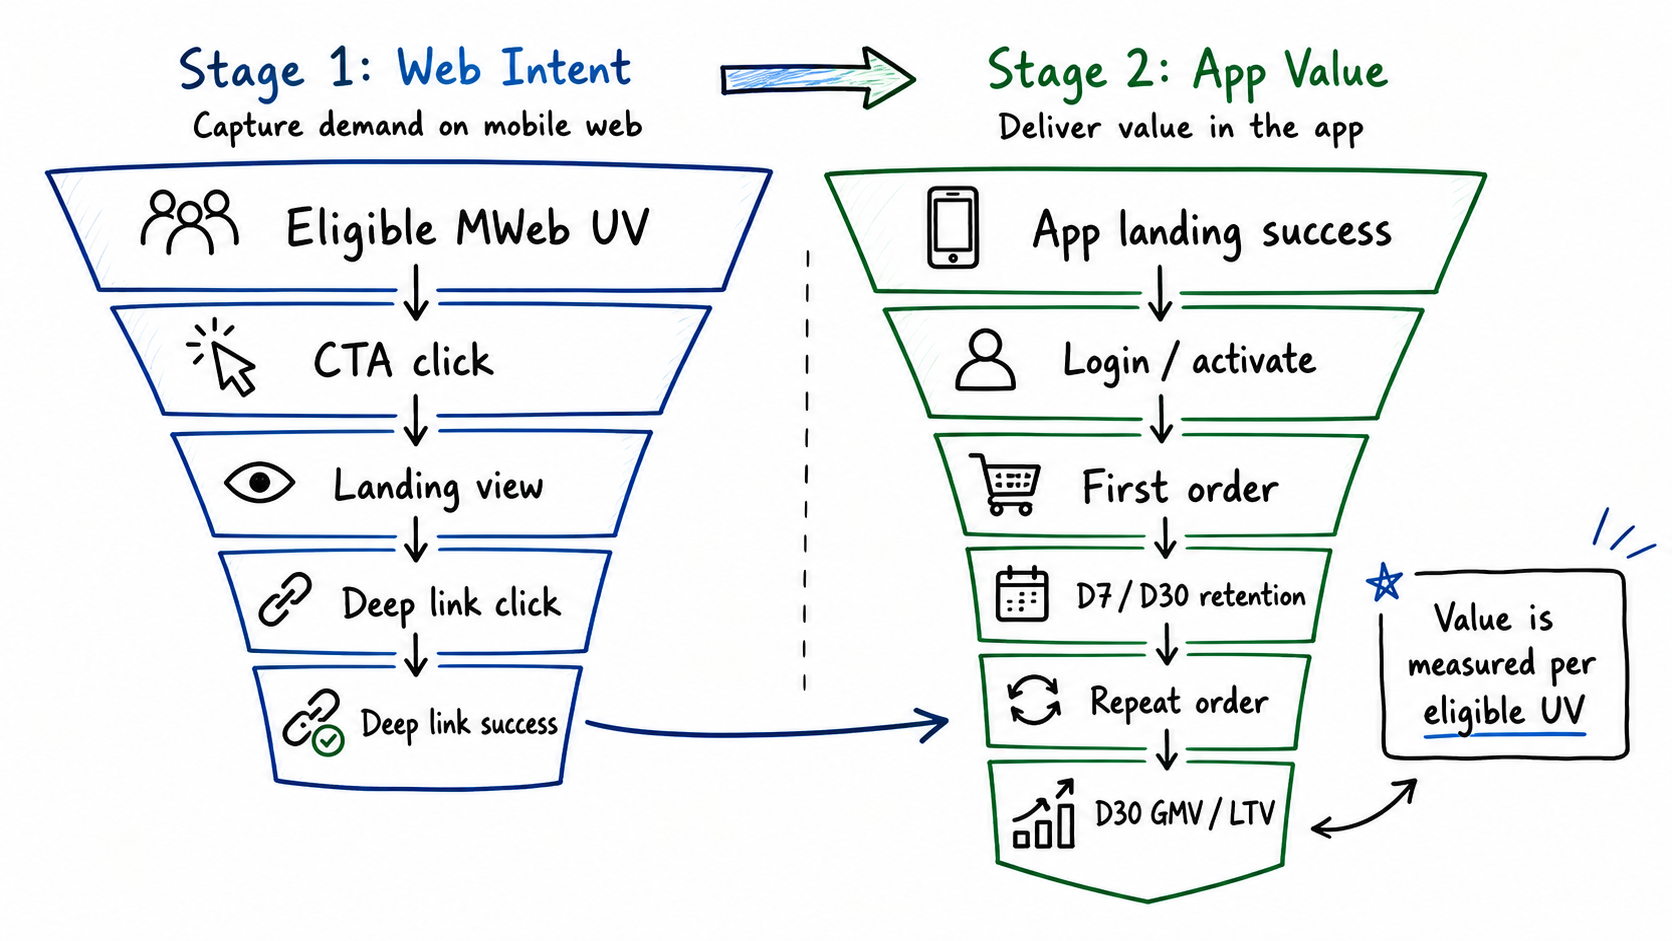
Figure: MWeb-to-App measurement funnel for the app landing experiment. Value is measured per eligible MWeb UV rather than total GMV alone. generated by gpt-image-2.
Each layer answers a different question:
| Step | Metric | Meaning |
|---|---|---|
| MWeb Eligible UV | MWeb users eligible for experiment | Denominator. Do not mix with sitewide UV |
| CTA Click | Purchase / open app click | Whether there is purchase intent |
| Landing Page View | Landing page arrival | Whether Web-side navigation works |
| Deep Link Success | Deeplink success rate | Whether the technical chain works |
| App Landing Success | Target app page arrival | Whether product, campaign, and coupon are preserved |
| Login / Activate | Login / activation rate | Whether identity handoff is complete |
| First Order | First order rate | Whether it really brings transaction |
| D7/D30 Retention | Retention | Whether users have long-term value |
| Repeat Order | Repurchase | Whether retention turns into purchase |
| D30 GMV / LTV | Long-term value | Whether the project is worth doing |
Experiment design
We can design an A/B experiment:
1 | Experiment population: |
Experiment structure:
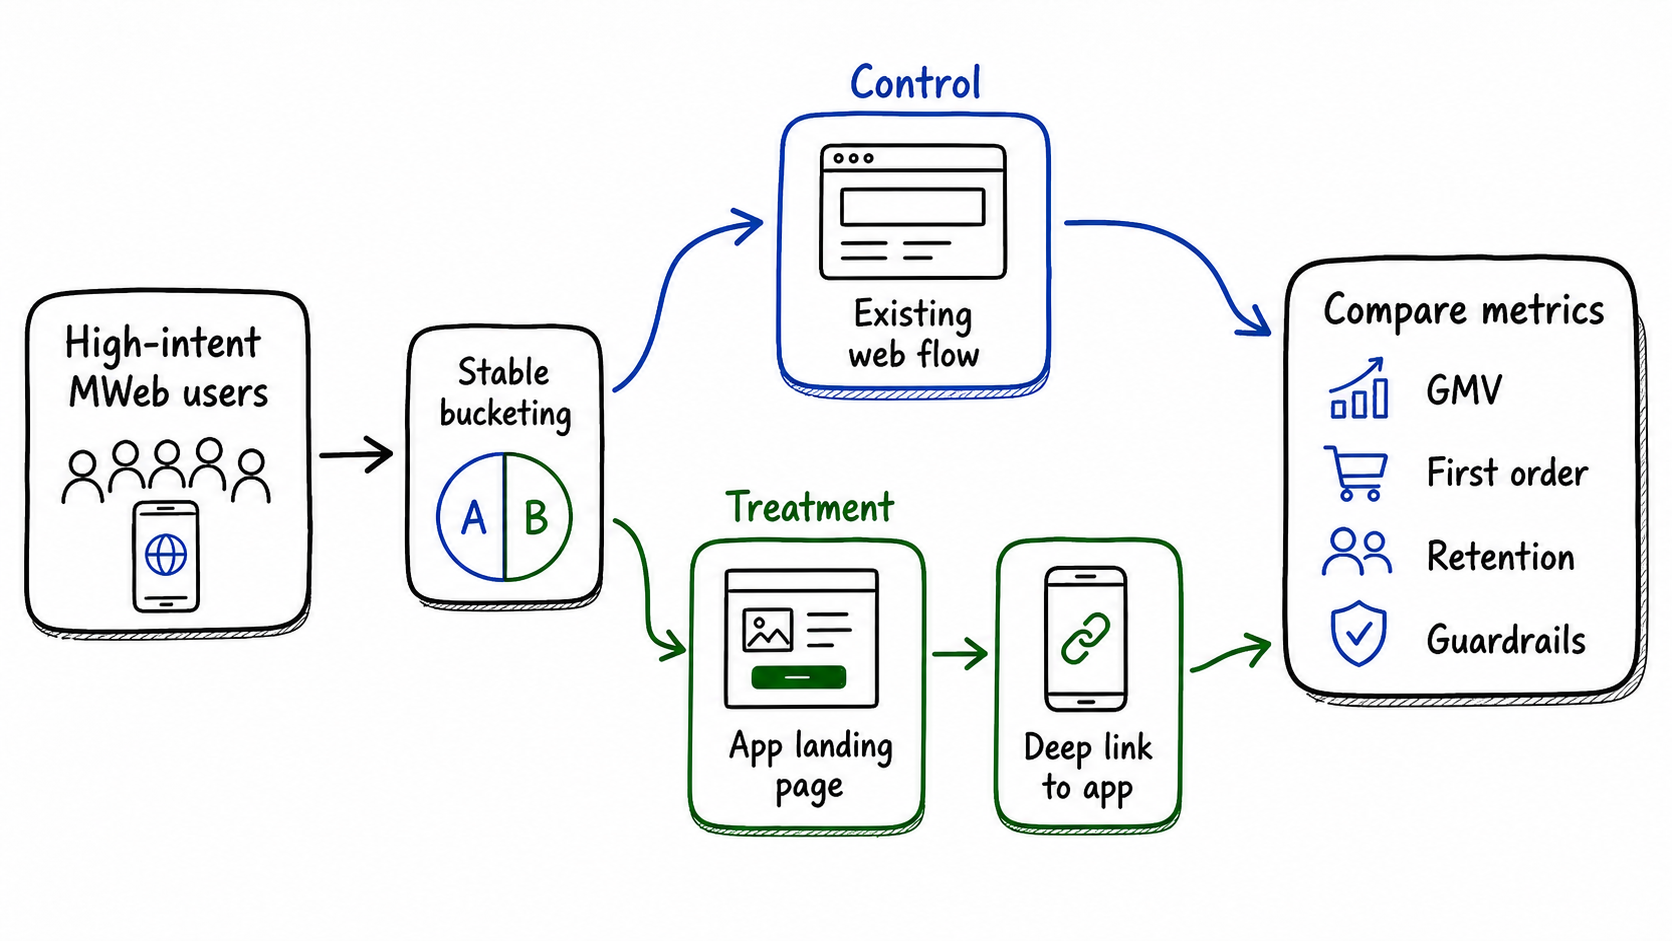
Figure: A/B experiment split for the app landing page. Stable buckets keep control and treatment comparable while metrics and guardrails decide rollout. generated by gpt-image-2.
Metric design
The Primary Metric can be:
Why this metric?
Because it constrains three things at the same time:
| Constraint | Meaning |
|---|---|
| Web-assisted | Must be attributable to a Web touchpoint |
| App paid GMV | Must really transact inside the app |
| per eligible MWeb UV | Look beyond total GMV and measure value per unit of traffic |
Secondary Metrics:
1 | Landing Page View Rate |
Guardrail Metrics:
1 | Web Direct GMV |
Tracking and attribution requirements
Whether this experiment can be judged clearly depends less on the page and more on attribution.
There must be a stable web_attribution_id that passes from MWeb all the way to the app order:
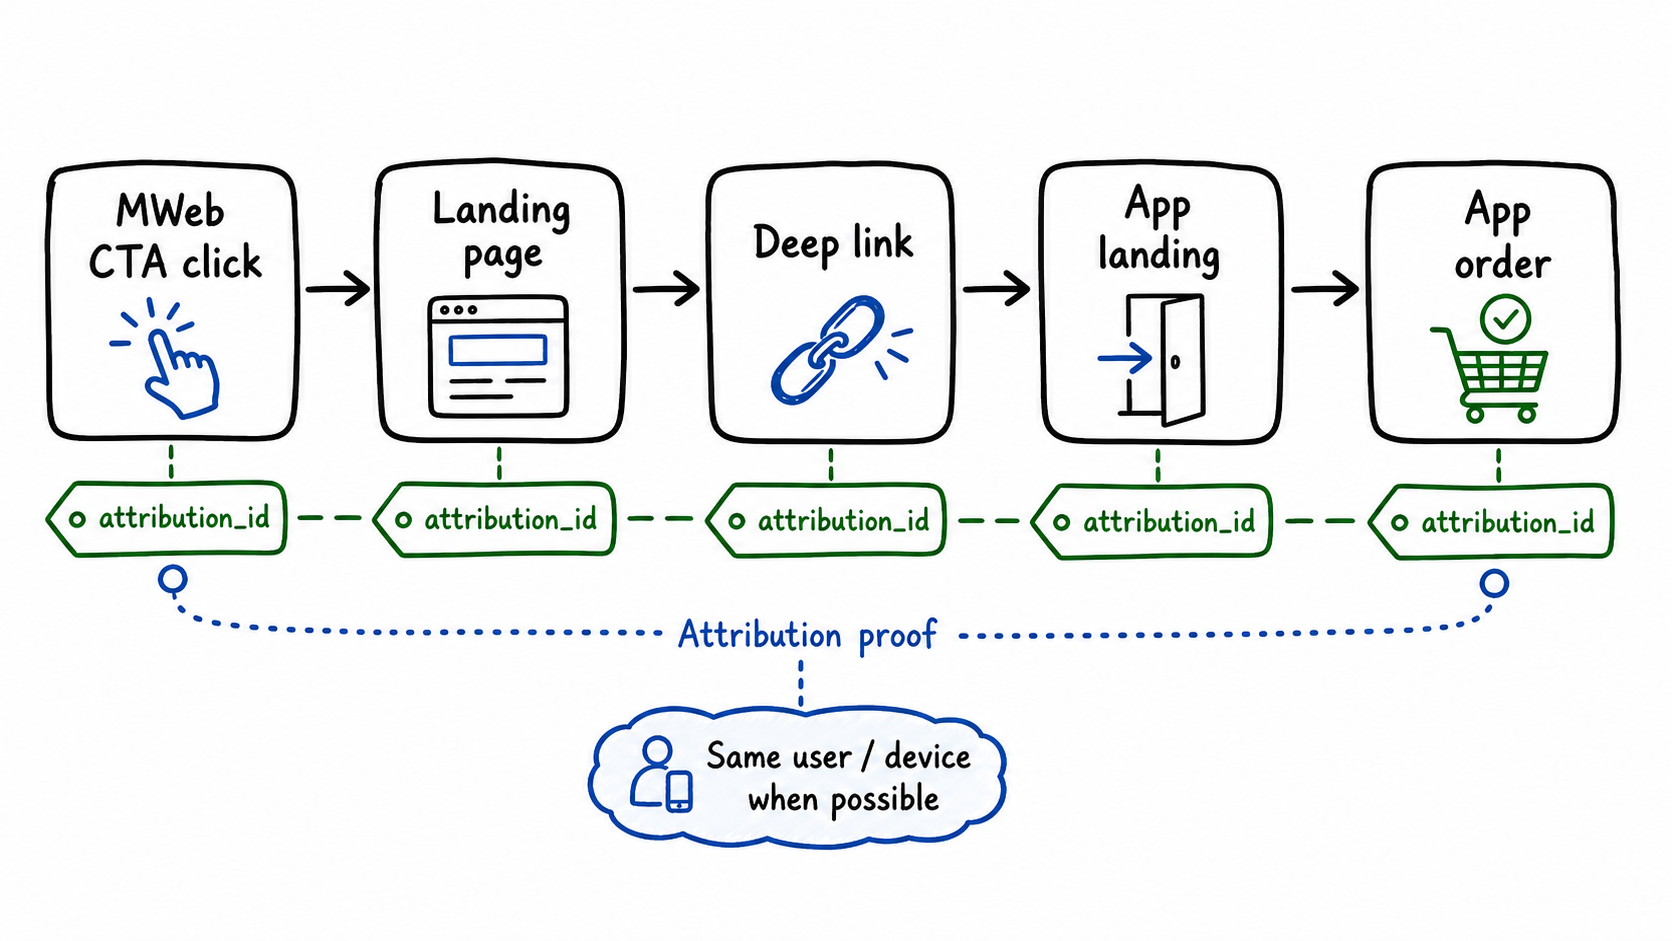
Figure: Cross-channel attribution handoff. The web touchpoint carries an attribution_id through landing, deeplink, app landing, and app order. generated by gpt-image-2.
Key events include:
1 | mweb_buy_now_click |
Key parameters include:
1 | web_attribution_id |
Without web_attribution_id or a similar attribution field, even if app orders increase, we cannot prove that the increase came from the Web change.
Decision method
After the experiment ends, do not roll out just because one metric increased. Judge by situation.
| Result | Judgment |
|---|---|
| App open increases, First Order does not | Landing is weak. It only transports traffic |
| First Order increases, Web Direct GMV drops more | It may cannibalize Web. Not necessarily worth rollout |
| App GMV increases, D7/D30 retention is poor | Low-quality conversion. Long-term value is insufficient |
| Web-assisted App GMV increases, total GMV increases, guardrails are normal | Rollout is reasonable |
| Deep Link Success is low | Fix the technical chain first. Do not rush to optimize UI |
| App Landing Success is low | Product / coupon / page context is lost. Fix the landing handoff |
The ideal result is:
1 | Treatment group |