I built a performance optimization skill for an AI agent. The interesting part was not patch generation. Every patch had to pass through a harness, a goal, and a ledger. In one Workspace run, strict profiles showed improvements such as Workstream 5089ms -> 2519ms and Report Center 10021ms -> 6762ms. The first important round was less glamorous: it repaired the FMP measurement contract so later numbers meant something.
The real problem
The target looked simple: improve Workspace FMP.
The actual target was stricter:
| Metric | Goal |
|---|---|
| Subapp FMP P90 | 2.5s |
| Workspace shell FMP | 1s |
Normal AI coding is too weak for this job. If you ask an agent to “make FMP faster,” it will happily suggest lazy loading, chunk splitting, prefetching, caching, and SDK deferral. Some of those ideas may be correct, but without a harness the agent is optimizing a story, not a system.
So I designed the skill around a different contract:
1 | No strict measurement, no performance claim. |
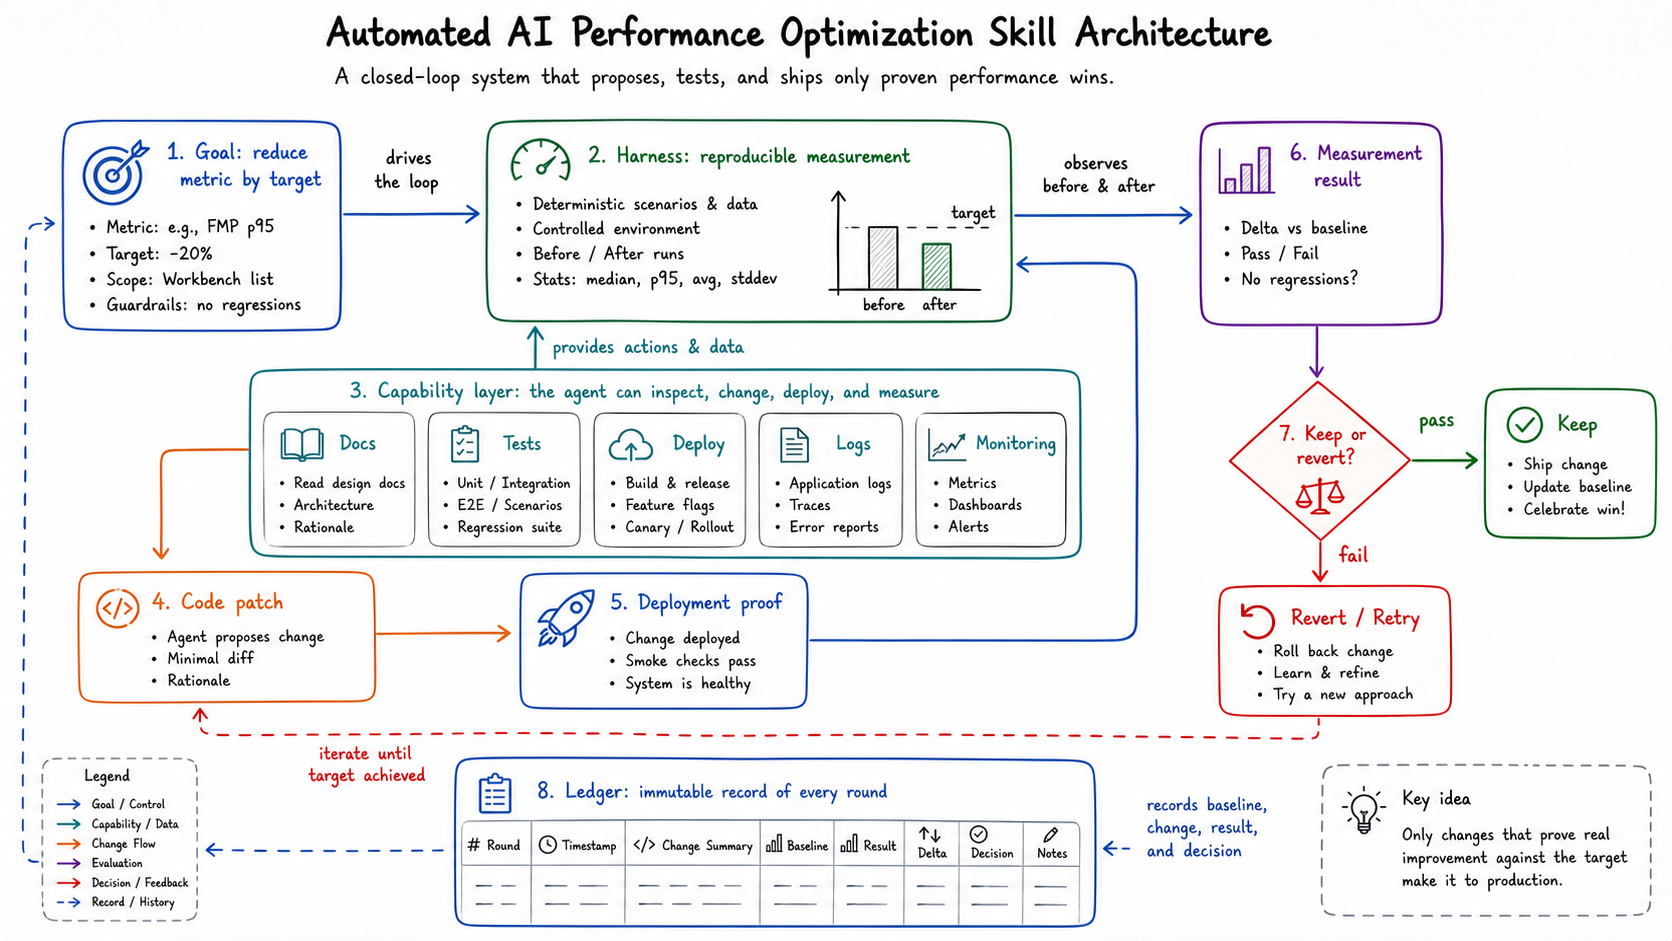
Figure: the skill architecture: goal, harness, capability layer, patch, deployment proof, and ledger. generated by gpt-image-2.
The agent can write code, but code is only one step in the loop. The loop owns profiling, waterfall diagnosis, local verification, deployment, strict comparison, and documentation.
Harness first, optimization second
The first useful ledger entry was ugly. It said the production route did not emit valid final FMP reports for the tested subapps.
Several routes ended with invalid or missing events:
| Symptom | Why it mattered |
|---|---|
window.custom_performace ended as {} |
Subapps could not find the host start time |
Some routes emitted not_access_from_url |
The subapp refused to report final FMP |
Some pages only had fallback marks like reactSubAppInit |
Those marks were diagnostics, not business FMP |
| Workstream list had no final list FMP event | The page could open, but the harness had no authoritative cutoff |
The root cause was not a slow chunk. It was a bad measurement data structure.
The host wrote one kind of key, subapps read another, and one idle reset could erase the map. Worse, some subapps used Object.keys(window.custom_performace).length === 1 as a route-origin detector. That is fragile: a timestamp map was being used both as data storage and as a state machine.
The first fix was therefore measurement repair:
- Preserve and normalize the host FMP session.
- Write canonical app keys instead of route-shaped keys.
- Make direct-route source explicit.
- Let each subapp validate its own expected key.
- Add missing final FMP reporters, especially for Workstream list.
This produced no user-visible speedup by itself. It made the later speedups trustworthy. That is the kind of work a performance loop must do, and the kind of work an unguarded agent tends to skip.
The goal-driven loop
The skill runs one round at a time:
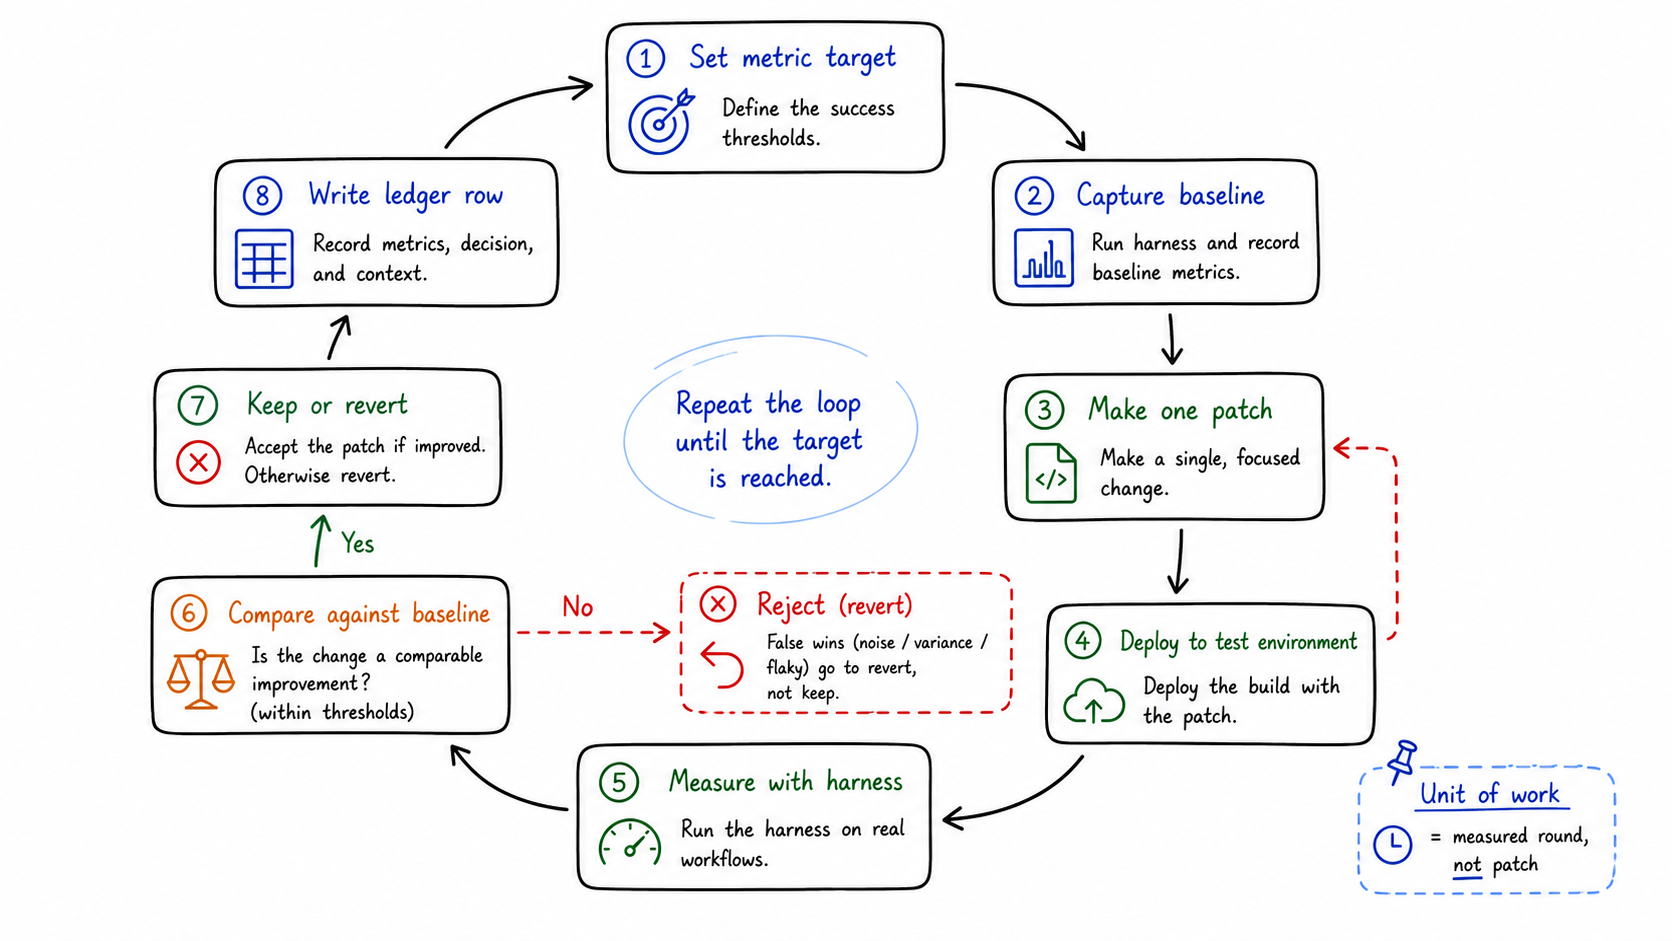
Figure: one measured round, not one patch, is the unit of work. generated by gpt-image-2.
1 | profile -> waterfall -> diagnose -> fix -> local verify -> commit/push |
Each strict profile uses the same kind of capture:
- authenticated route;
- target deployment lane headers;
- same route and final marker;
- CPU 4x slower;
- fast 4G network profile;
- disabled cache;
- Service Worker enabled when that matches the production path;
- runtime version proof.
The verdict vocabulary is part of the system:
| Verdict | Meaning |
|---|---|
| strict win | Same route, same marker, same throttling, better result |
| directional | Useful signal, but not a strict comparison |
| measurement repair | The harness was wrong; no speedup claim |
| not a win | Metric or user experience regressed |
| not measured | Code shipped, but no valid profiling comparison |
This looks bureaucratic until you have a failed optimization. Then it becomes the difference between engineering and self-deception.
Compressed into a minimal skill contract, I would keep only these rules:
1 | Run measured rounds until the goal is reached. |
What changed in the successful run
After the measurement contract was repaired, the loop could optimize real bottlenecks.
One strict-profile summary:
| App / route class | Before FMP | After FMP | Delta | Main reason |
|---|---|---|---|---|
| Workstream | 5089ms | 2519ms | -2570ms / -50.5% | removed startup payload, warmed list API, moved notification/DnD/editor/actions after final FMP |
| Report Center | 10021ms | 6762ms | -3259ms / -32.5% | moved notification work after FMP and fixed prefetch body/cache-key alignment |
| Scheduling | 10367ms | 7630ms | -2737ms / -26.4% | waited for the real final marker and started init-dependent prefetch after core data was ready |
| Audit Workbench | 12610ms | 10188ms | -2422ms / -19.2% | moved notification after FMP and shortened chunk, render, and query timing |
There was also a weekly P90 view across modules. Some routes reached the 2.5s target, some got close, and some still missed it. That distinction matters. A serious performance system should report both the wins and the remaining gap.
Pattern 1: post-FMP scheduling beats blind deferral
The easy version of deferral is setTimeout. That is garbage. It is disconnected from the product’s real readiness.
The safer version waits for a route-specific final first-screen mark:
1 | function finalMarksForRoute(pathname: string): string[] { |
Notification work is a good example. The download bar itself was not always the parser blocker. The real cost was SDK/auth/callback/API/main-thread work competing before the final marker. Moving it after the route-specific FMP mark improved the measured path without removing user-facing UI.
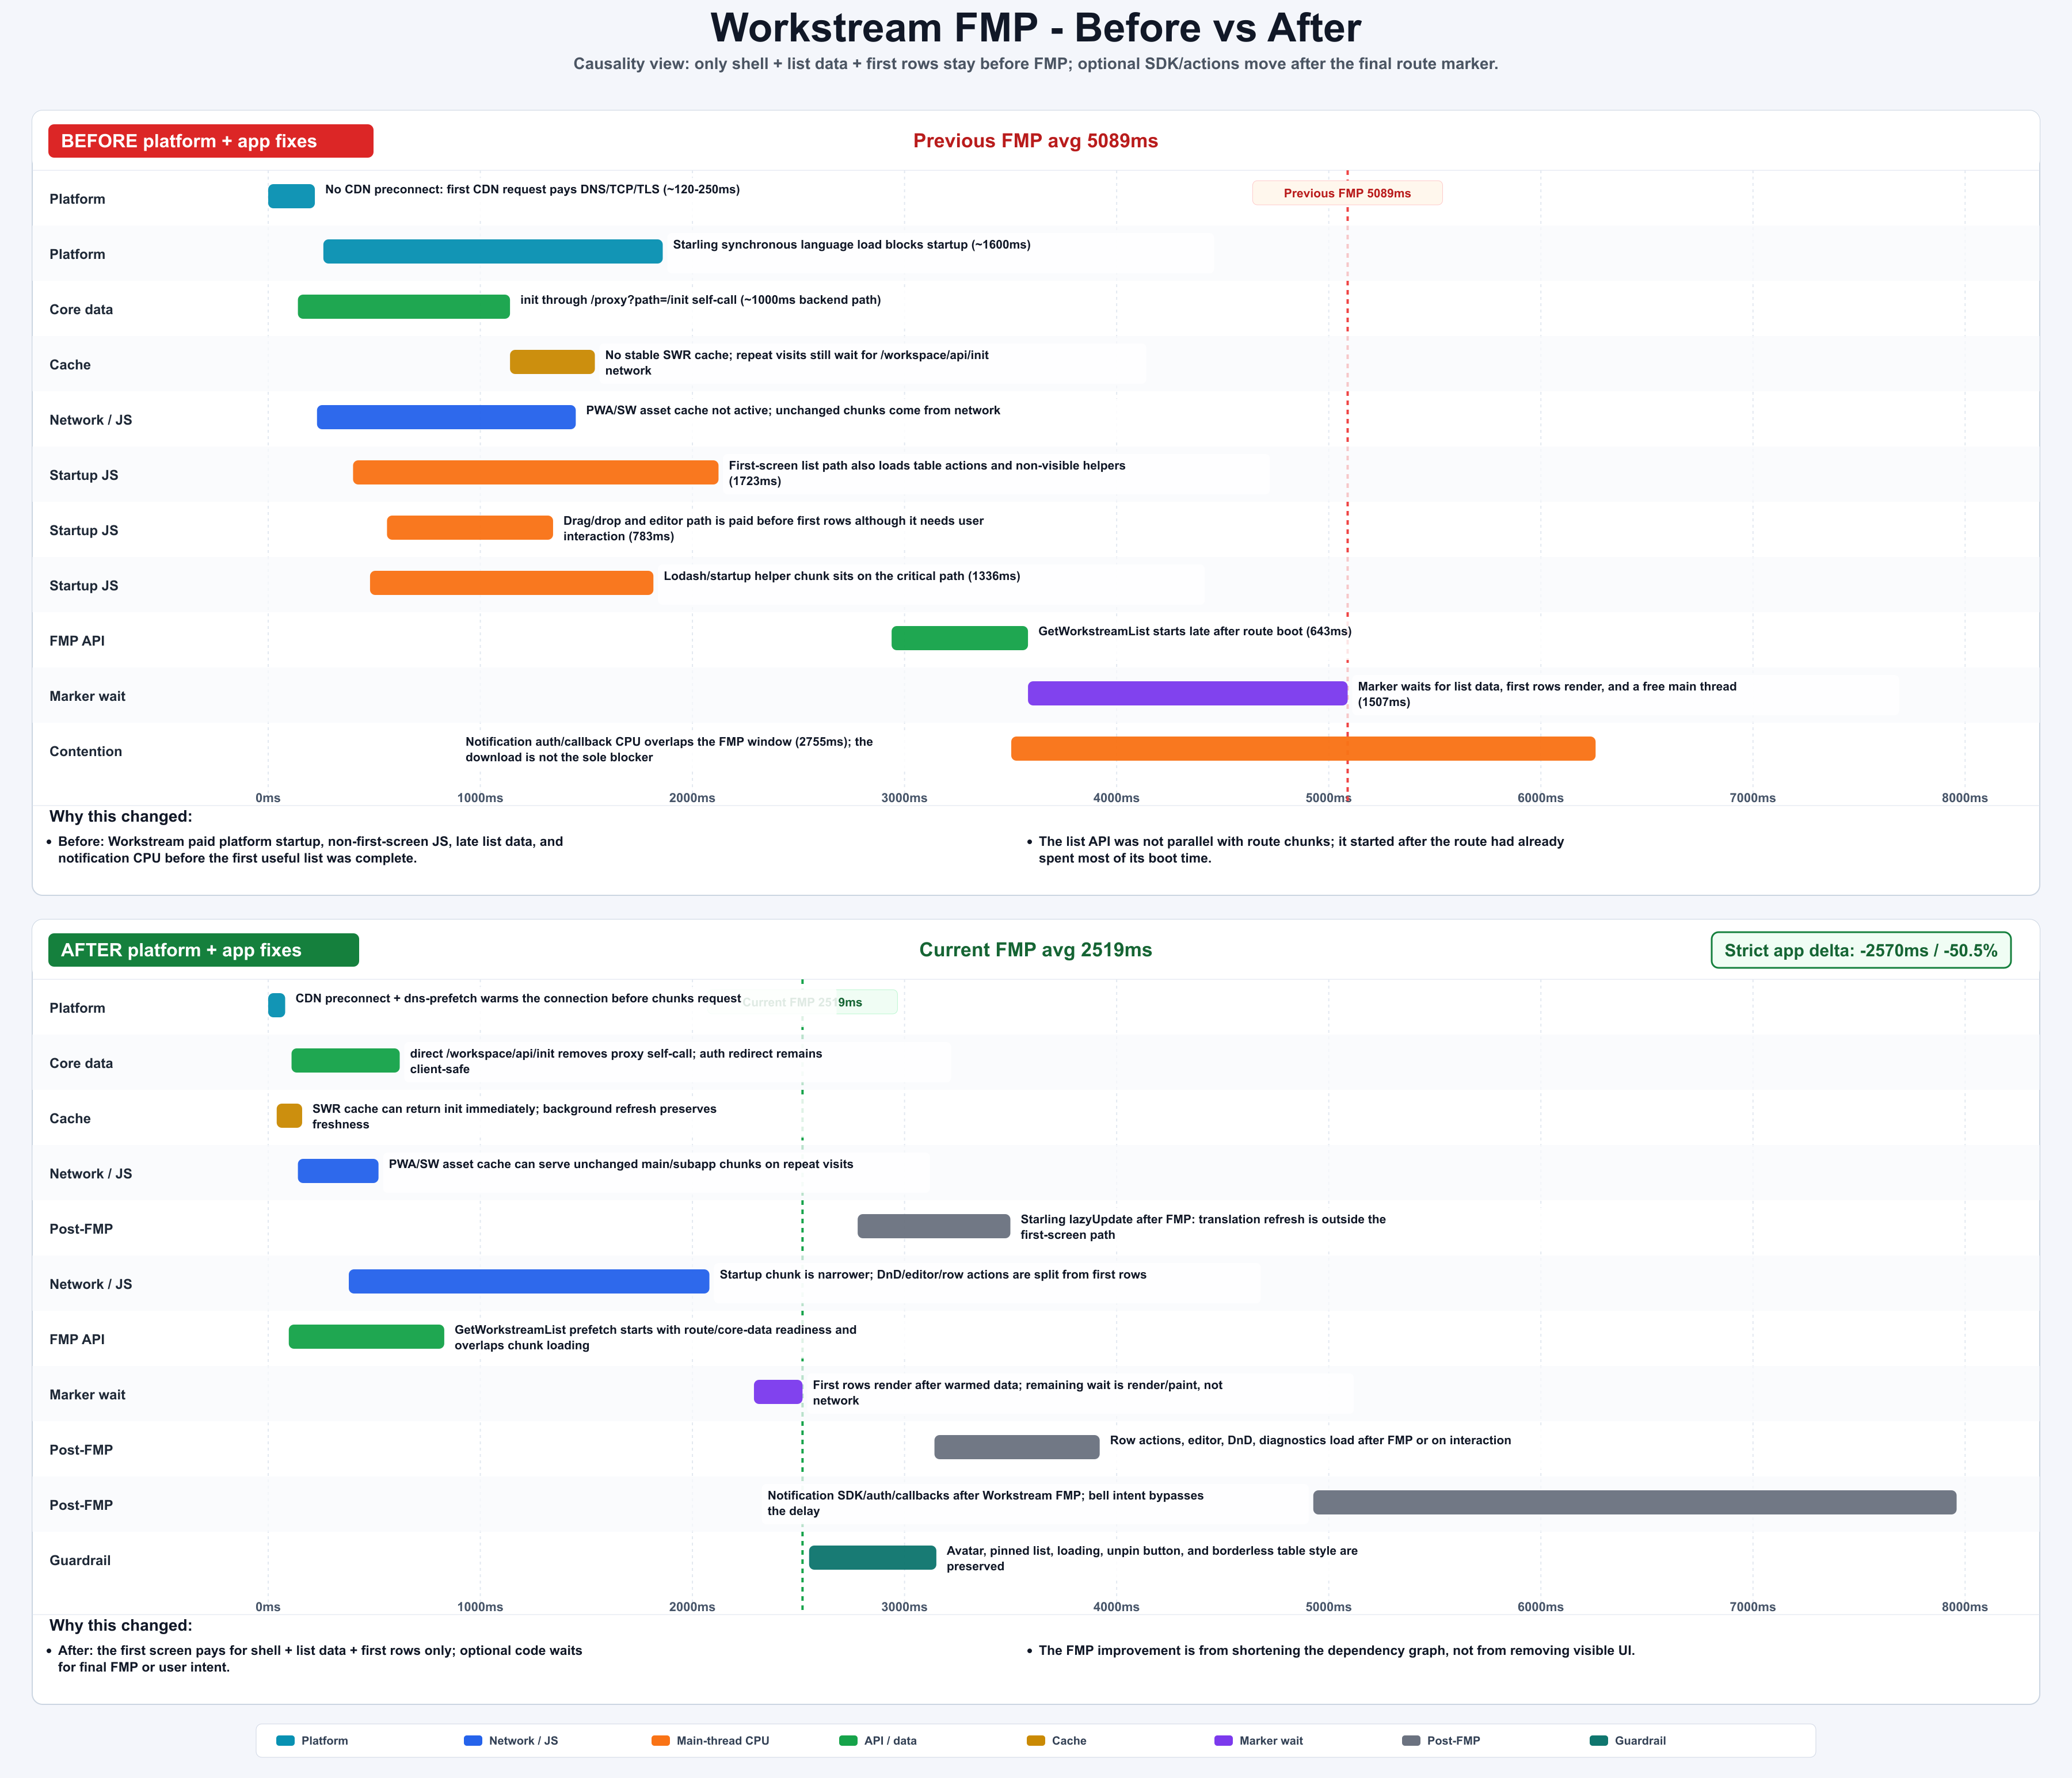
Figure: Workstream before/after FMP waterfall; optional SDK/actions move after the final marker. generated by gpt-image-2.
Pattern 2: prefetch is a contract, not a request
Report Center exposed the worst prefetch failure mode: the host fired a prefetch, but the consumer used a different body or cache key. The network request existed, the page still waited, and the “optimization” became extra traffic.
The rule that came out of the ledger:
1 | The cache key is the contract. |
A valid prefetch must align:
| Item | Must match |
|---|---|
| endpoint | same URL |
| method | same method |
| operation | same GraphQL operation or REST identity |
| body / variables | same request identity |
| user context | same tenant, agent, access-party, or equivalent scope |
| consumer key | same cache key |
The consumer still needs a fallback. If metadata does not match, reject the warmed response and perform the normal request. Lost FMP benefit is acceptable. Wrong data is not.
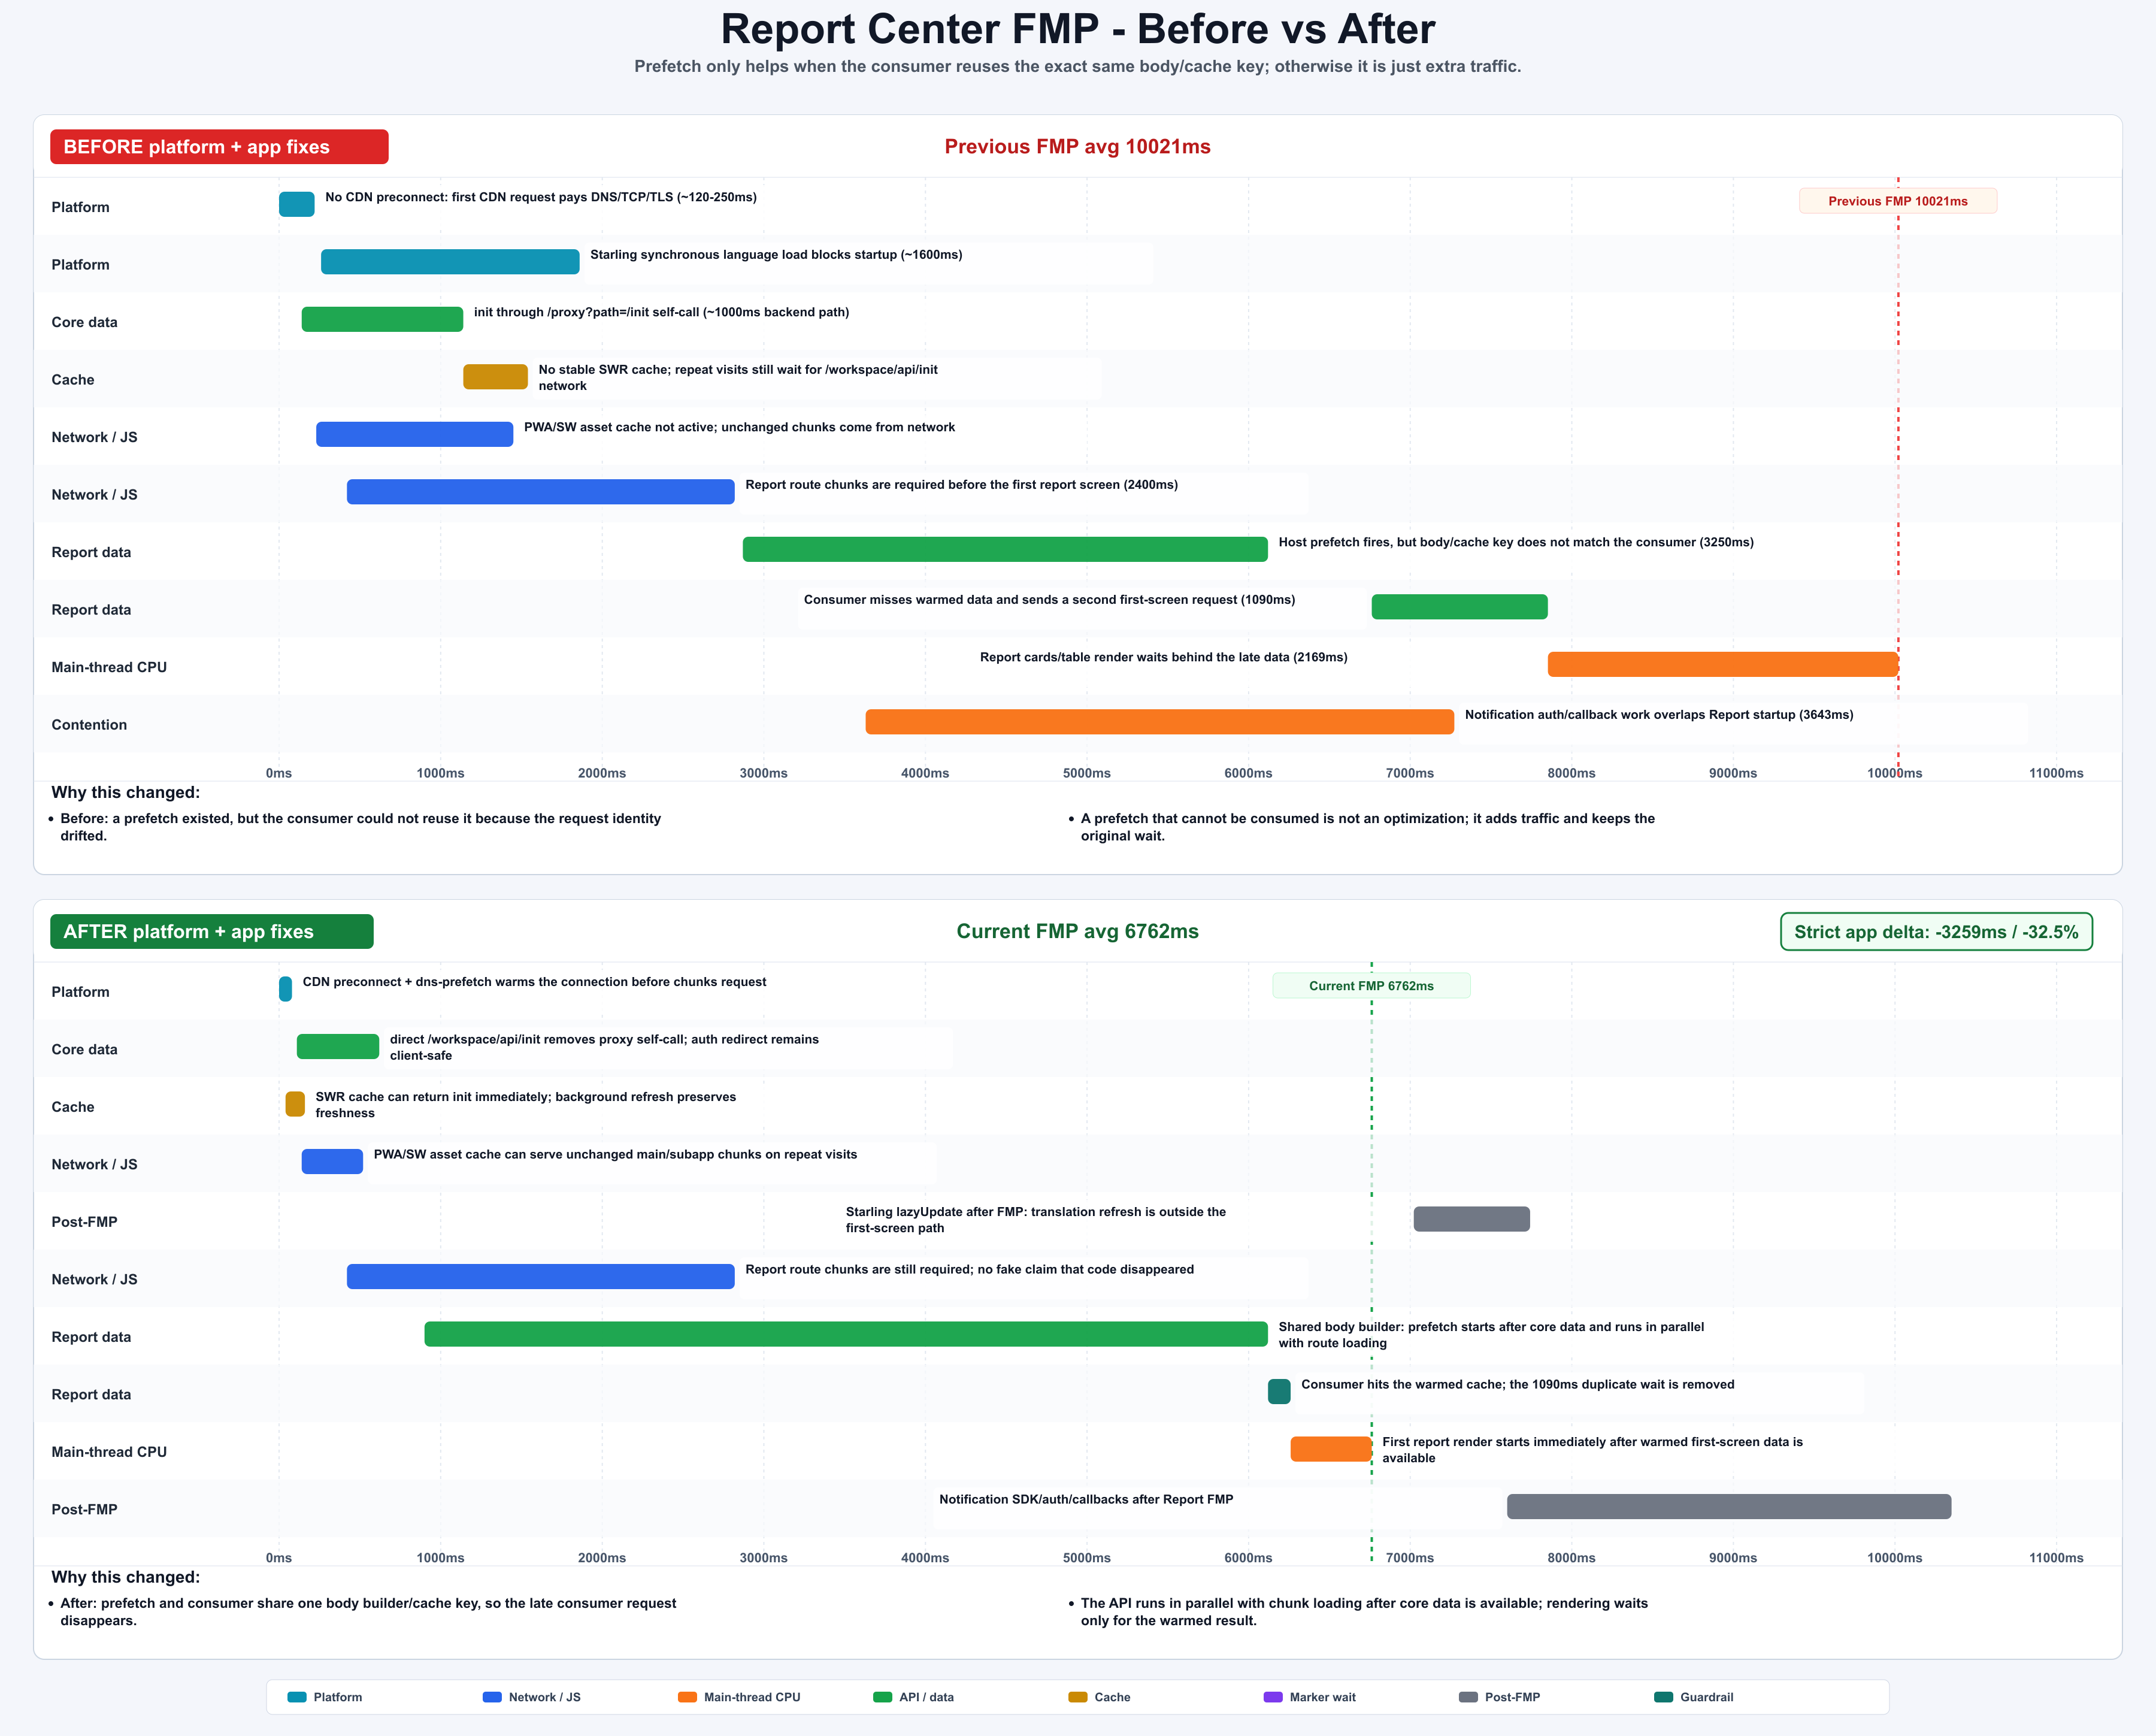
Figure: Report Center fixed a prefetch body/cache-key mismatch and moved notification out of FMP. generated by gpt-image-2.
Pattern 3: cache hits are real readiness signals
The system used two prefetch layers:
| Mode | Trigger | Suitable APIs |
|---|---|---|
| HTML inline prefetch | raw navigation time | route-deterministic APIs that do not need user/core data |
| core-data-ready prefetch | immediately after /workspace/api/init exists |
first-screen APIs needing tenant, agent, or access-party context |
The important detail: a Service Worker or memory cache hit for init data is still a valid readiness signal. If core data is available earlier, init-dependent prefetch should start earlier. Do not accidentally treat cached data as second-class.
This is also where the goal-driven loop matters. Prefetch has real cost: bandwidth, backend pressure, cache memory, and wrong-data risk. The skill only accepts prefetch when the first-screen request is deterministic, safe, and consumed under the exact same key.
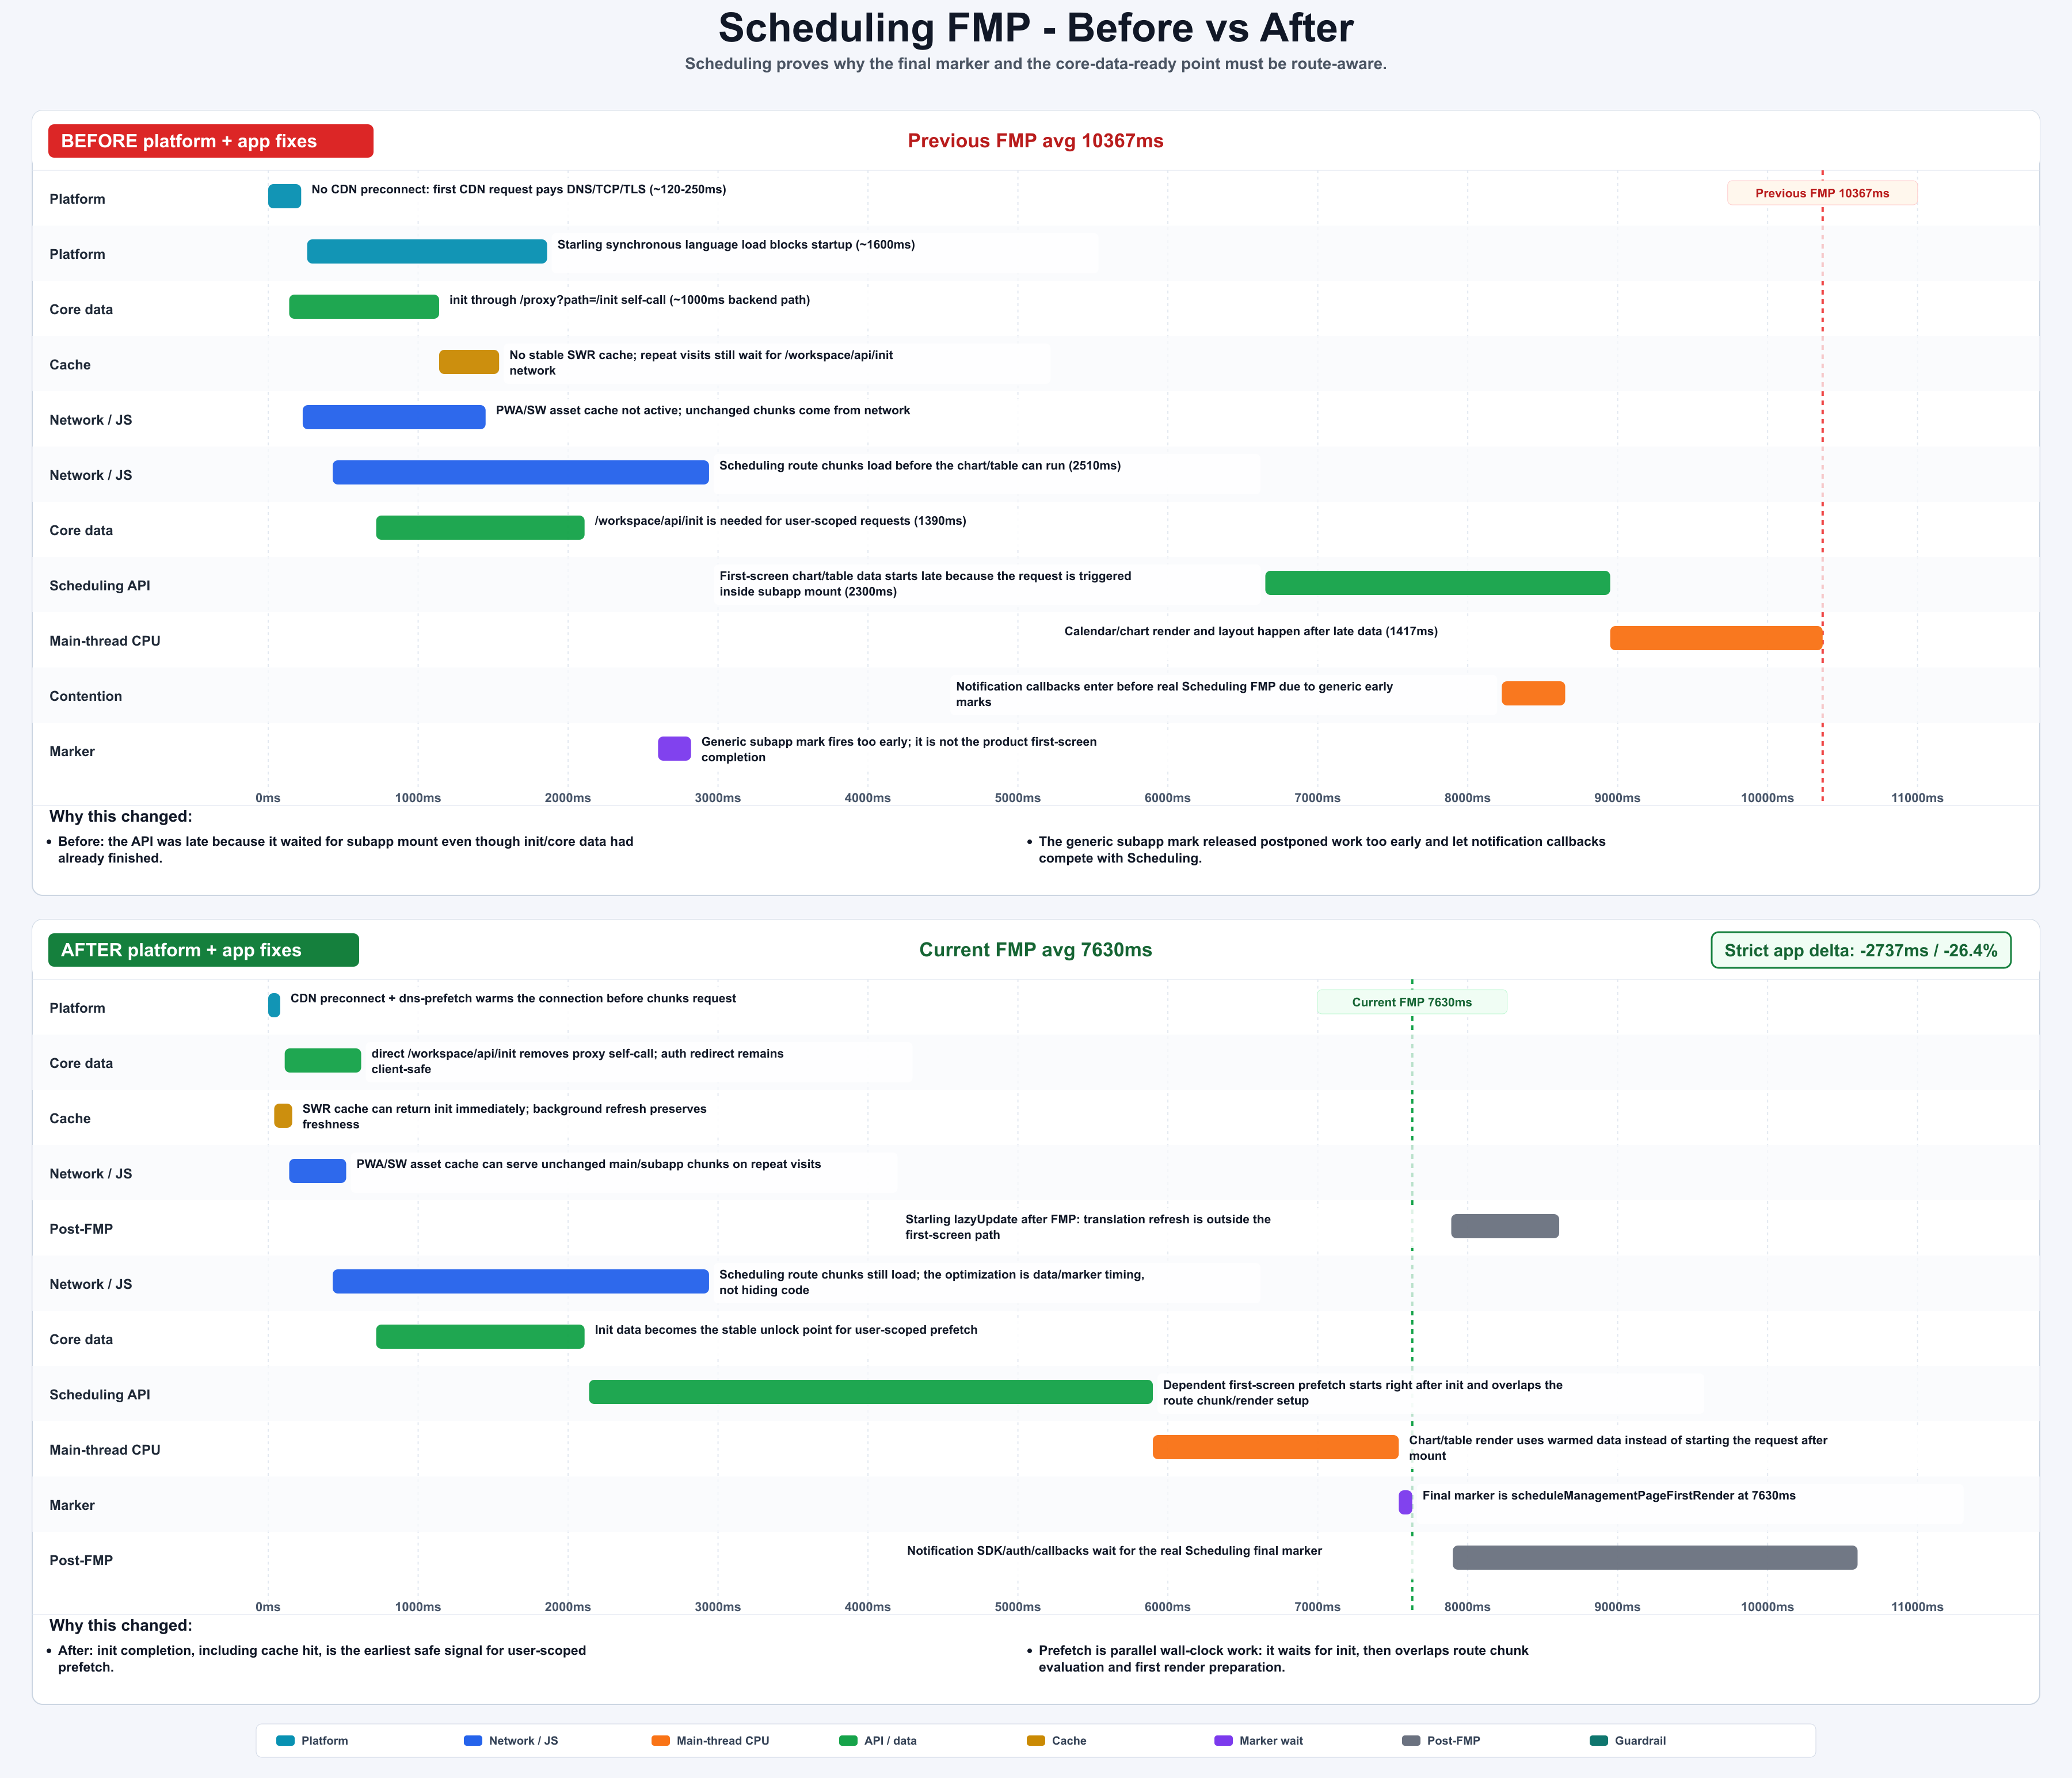
Figure: Scheduling waits for the real final marker and starts core-data-dependent prefetch earlier. generated by gpt-image-2.
Pattern 4: correctness guards are performance work
One intermediate Workstream optimization changed visible details: avatar, pinned section, loading style, table border, and unpin button styling. The ledger marked it as a correctness guard, not a performance win.
That is the right call. A faster page with broken visible behavior is not an optimization.
The final version preserved the UI while keeping non-first-screen work out of the FMP path. This sounds obvious, but it is exactly the sort of tradeoff an agent needs written into the skill. Otherwise it will happily optimize the chart and damage the product.
Similar failed rounds became hard evidence in the ledger:
| Attempt | Why it looked right | What the harness found | Verdict |
|---|---|---|---|
| Start first-screen prefetch earlier | One local marker moved earlier | Comparable profiles showed duplicate requests and no stable P90 improvement | Reverted |
| Defer a heavy component | Initial JS cost dropped | First interaction paid the deferred cost and post-visible long tasks got worse | Reverted |
| Reuse warmed cache | The second page felt faster | Stale first-screen data appeared under a different filter state | Reverted |
| Batch render updates | Render count dropped | The target metric stayed inside measurement noise | Not a performance win |
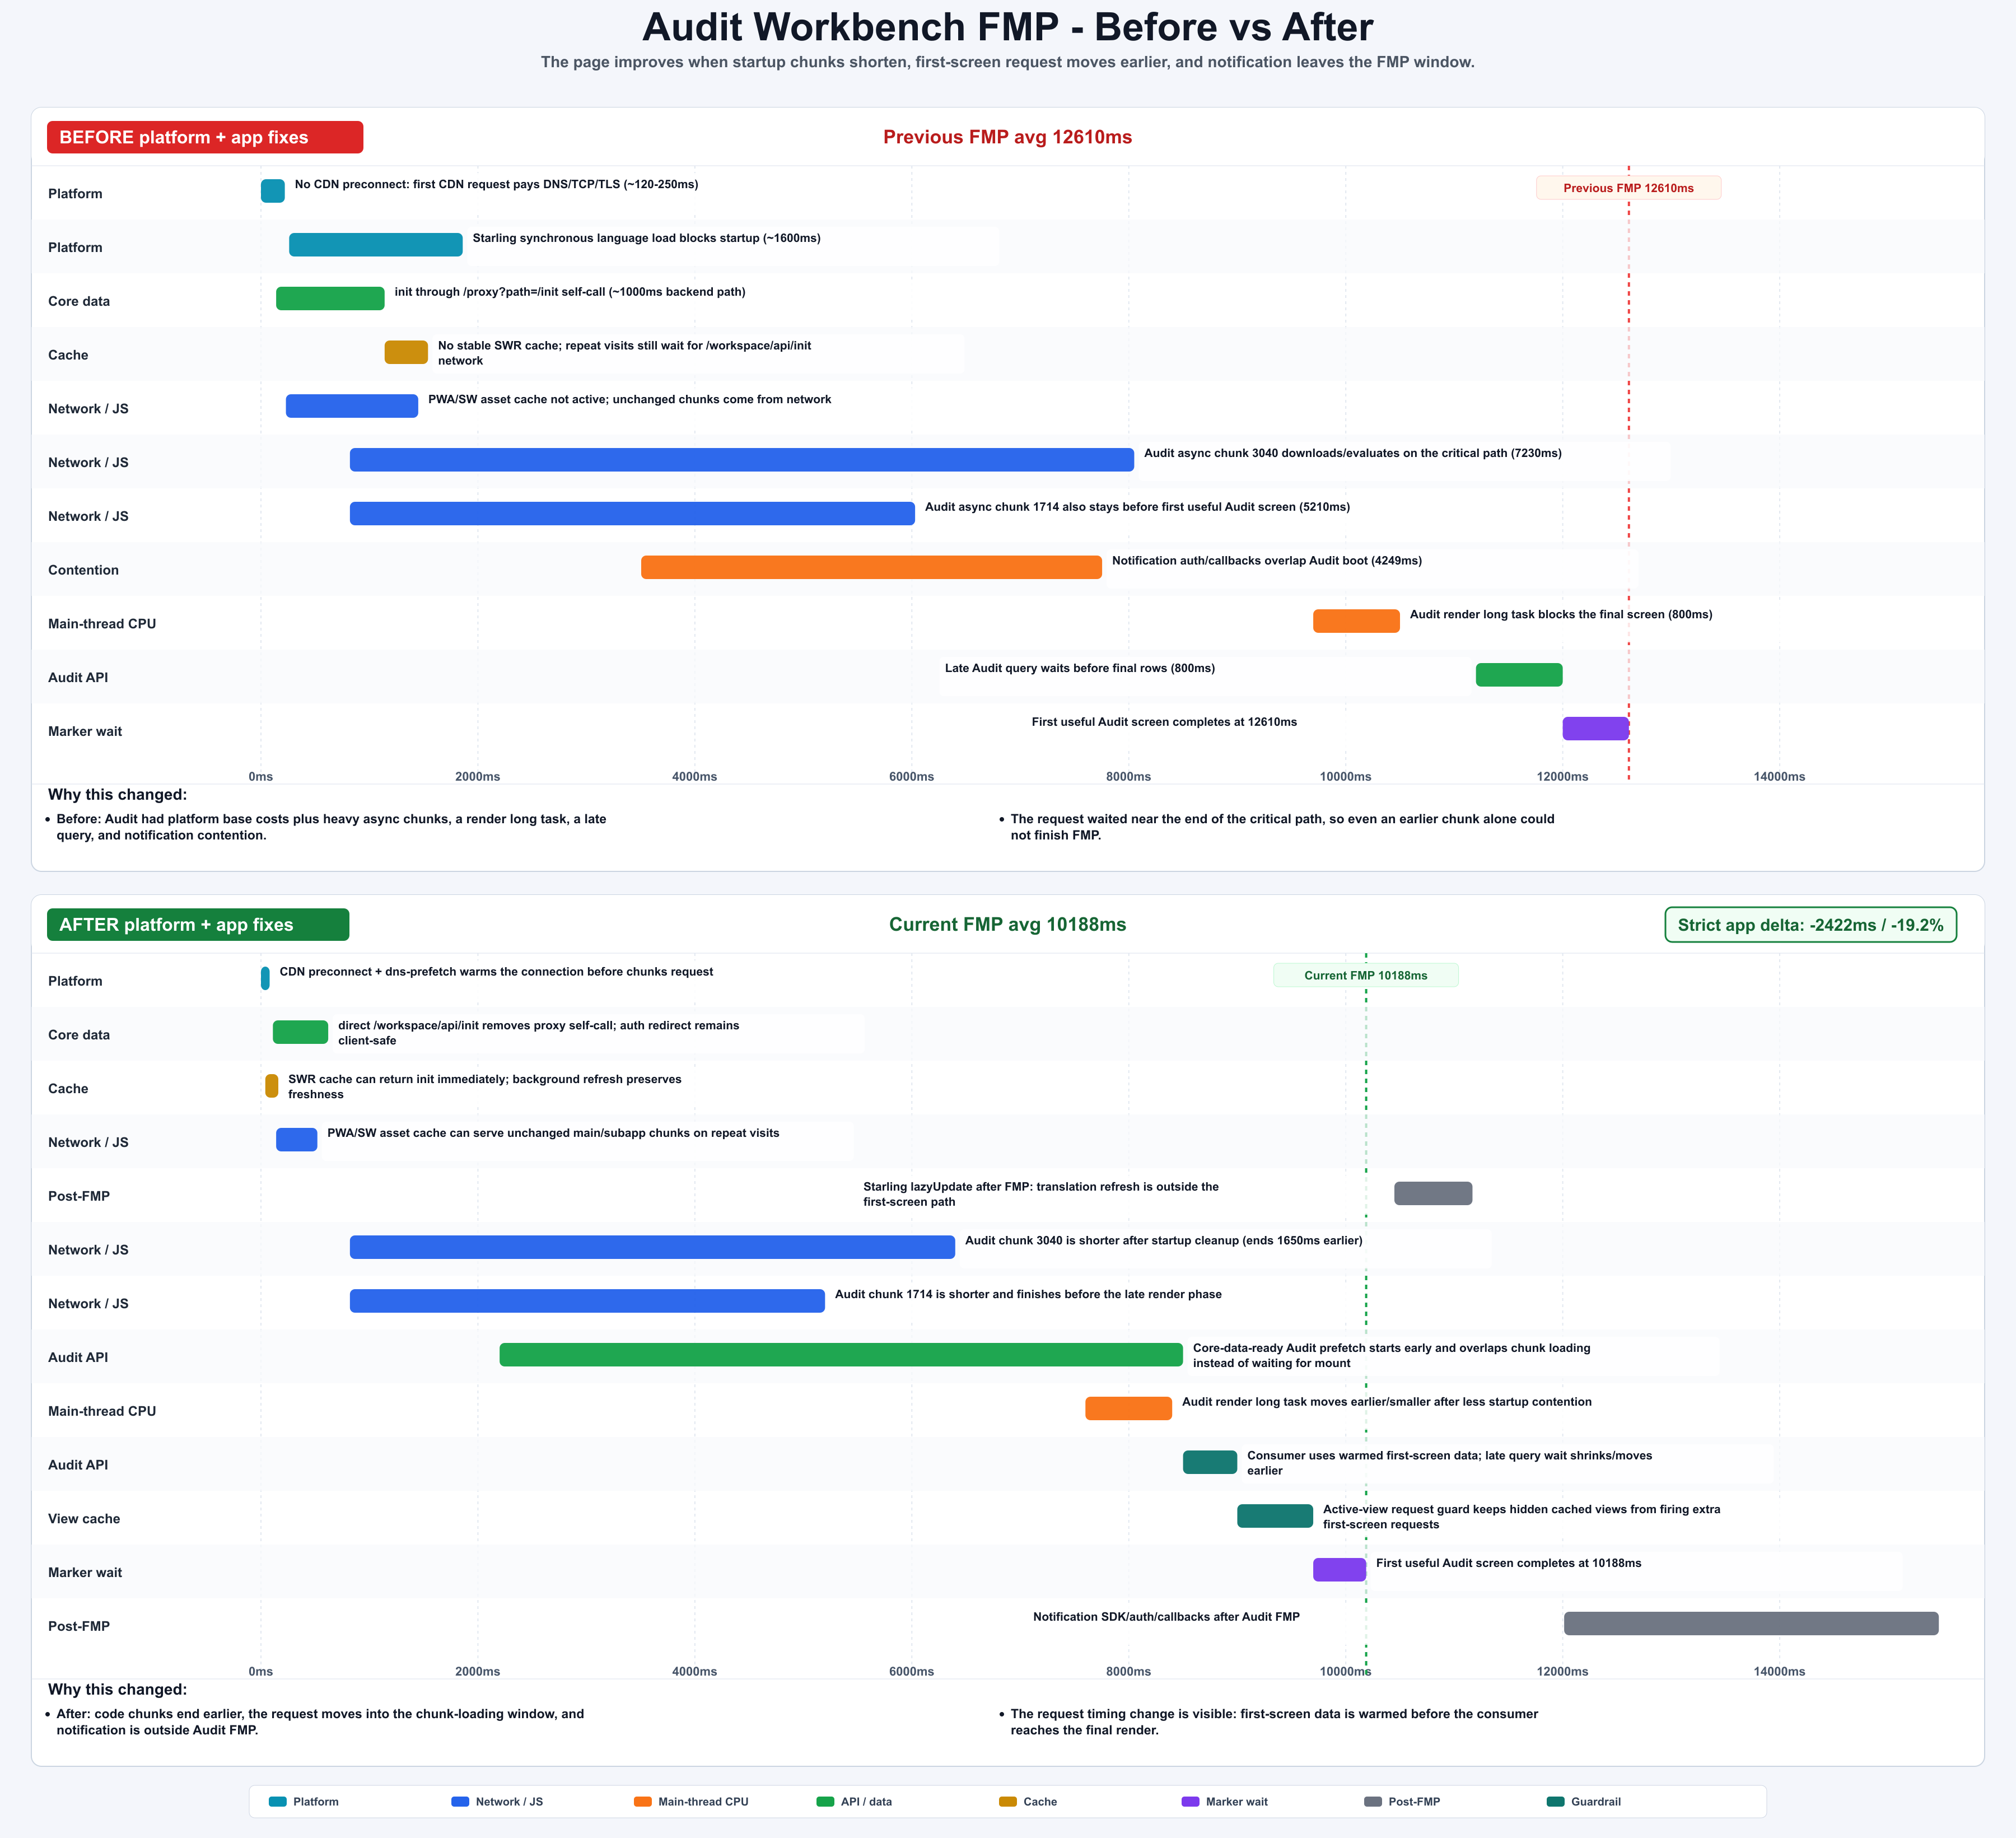
Figure: Audit Workbench combined chunk, render, query, and notification improvements; the total delta is measured by strict profiles. generated by gpt-image-2.
The ledger is the control plane
The ledger is not a diary. It is the control plane for the loop.
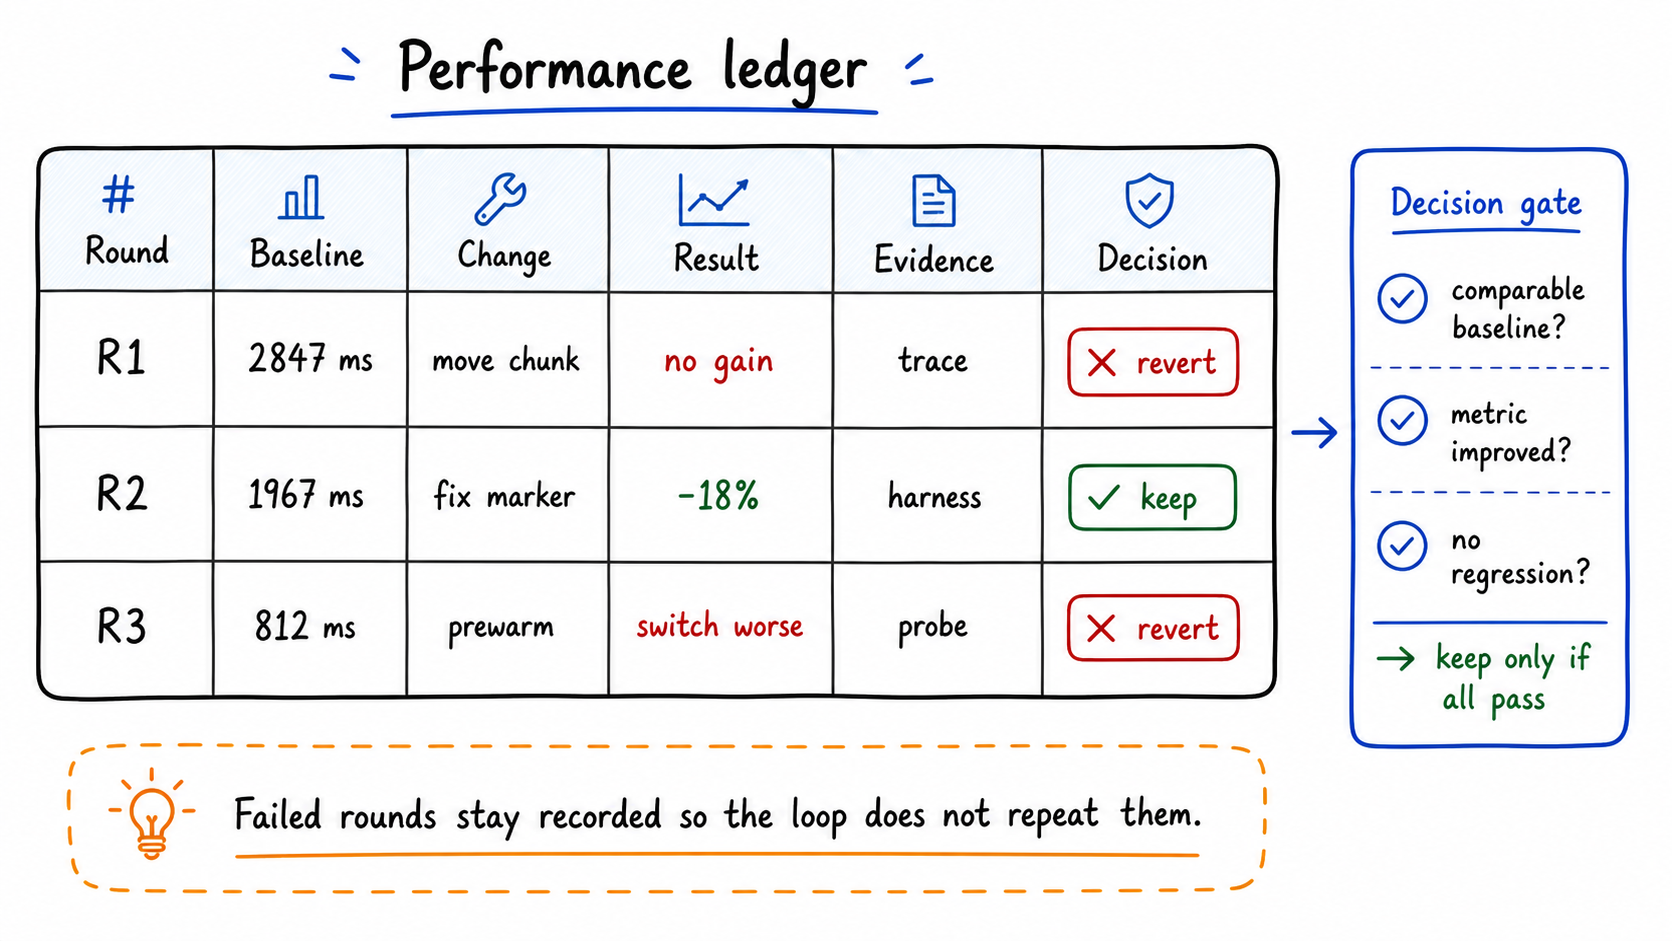
Figure: ledger rows prevent fake progress from becoming accepted progress. generated by gpt-image-2.
The best ledger rows were compact and harsh:
| Ledger rule | Why it matters |
|---|---|
| Previous valid strict profile becomes the next baseline | No convenient comparisons |
| Measurement repair is not a performance win | Correct numbers before clever patches |
| If current capture hits SSO, discard it | Login-page FMP is not app FMP |
If shell-visible improves but post-visible jank worsens, label not a win |
Do not move pain after visibility |
| One bottleneck, one patch, one comparison | Avoid stacked guesses |
This is why the system is goal-driven rather than prompt-driven. The goal picks the metric. The harness decides what evidence is valid. The ledger decides whether the round can be accepted.
What I would reuse elsewhere
You do not need the same internal infrastructure to copy the design.
The reusable structure is:
- Pick one user-visible metric.
- Build a repeatable harness for it.
- Define strict comparison rules before changing code.
- Make the previous valid profile the next baseline.
- Let the agent attack exactly one bottleneck per round.
- Treat measurement repair, regressions, and correctness fixes as first-class outcomes.
- Keep a ledger that records evidence, not activity.
The technical details will change across products. The loop is the part worth keeping.
The result I cared about was not one clever AI-written optimization. It was an agent running an engineering loop with evidence: observe, choose, change, deploy, compare, record, and keep going.